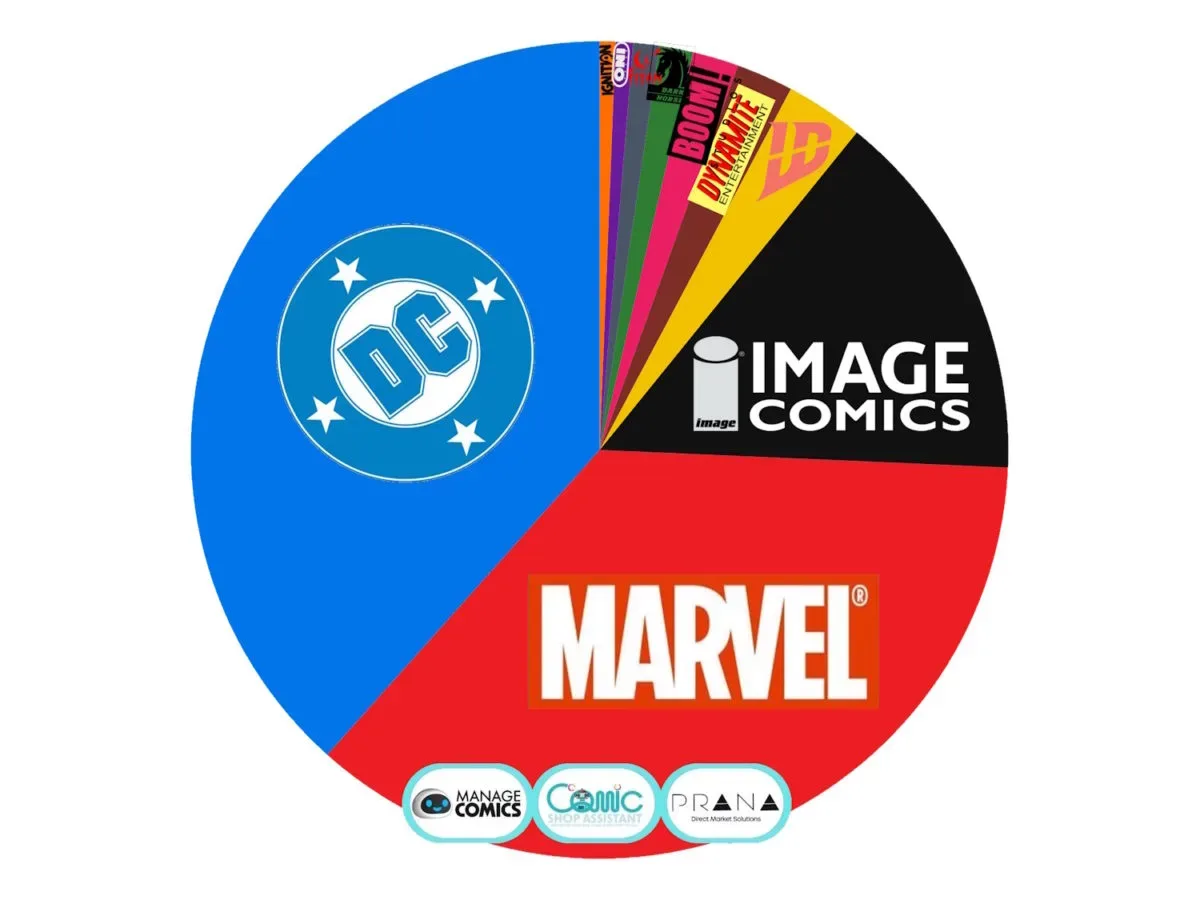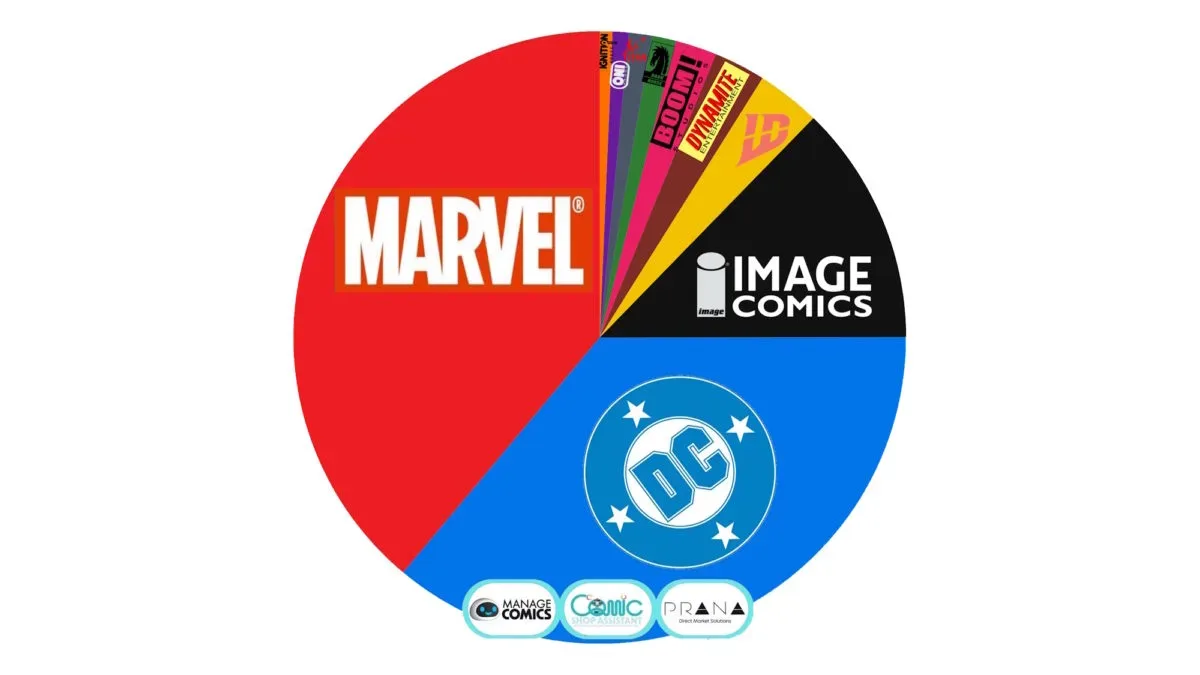

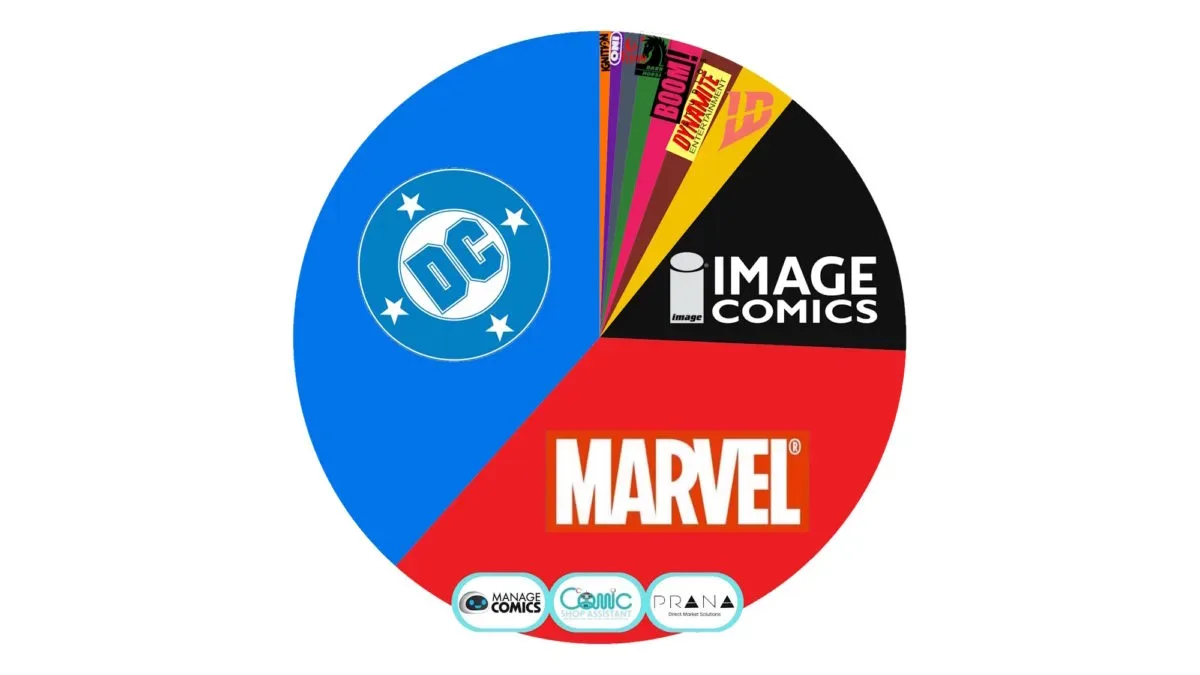
DC and Marvel finished remarkably close in a weekly snapshot of comic-shop sales, with DC taking 37.64% of reported direct-market share and Marvel following at 35.21%. The difference is 2.43 percentage points: a slim margin at the top of a chart where the two publishers together represented 72.85% of the measured activity.
The reporting period ran from September 8 through September 14, 2026. Spawn ’77 #1, credited to Todd McFarlane and Mark Spears, was the top individual seller in the same data set. That result put an Image title above a top three otherwise rounded out by Batman Bad Seeds Gotham Central #1 and Transformers #36.
It is a useful week-to-week picture of what moved through participating comic shops, but it is not a complete census of every direct-market retailer or every form of comics retail. The figures use point-of-sale information from more than 600 stores using the Manage Comics and Comic Shop Assistant systems. That is a substantial sample, yet the estimated direct market includes roughly 1,800 to 2,000 ordering stores. Readers should therefore treat the percentages as a measured sales snapshot, not an absolute accounting for the entire comics business.
Weekly publisher shares
The leading publishers were separated into a clear top three. DC’s 37.64% put it first, Marvel’s 35.21% kept it within striking range, and Image recorded a notable 14.56%. Image therefore accounted for more than one-seventh of the reported weekly market while still sitting well behind the two major superhero publishers.
For more context, explore Gladio Mori Hits 1.0 on PC, PS5 and Xbox Series X|S With Crossplay and Console Mods.
- DC: 37.64%
- Marvel: 35.21%
- Image: 14.56%
- IDW: 3.02%
- Dynamite: 2.21%
- Boom: 1.79%
- Dark Horse: 1.31%
- Titan: 1.01%
- Oni: 0.67%
- Ignition: 0.61%
The top three add up to 87.41% of the reported market share. The remaining publishers listed, from IDW through Ignition, collectively make up 10.62%. Because only the named publishers are included in this breakdown, those figures should not be treated as a claim that no other publishers made sales during the week.
Spawn ’77 #1 takes the weekly crown
Spawn ’77 #1 establishes the 100% baseline for the top-ten ranking. The numbers beside every other issue are not publisher-market-share percentages and are not raw copies sold. They are relative sales ratios: each book’s reported sales level compared with the week’s number-one book.
For example, Batman Bad Seeds Gotham Central #1 posted 63.15% of the top seller’s level, while Transformers #36 reached 61.69%. That makes the gap between second and third just 1.46 percentage points on this particular relative scale. The chart does not provide issue-by-issue unit totals, so it cannot tell readers how many copies separated them.
- Spawn ’77 #1 — 100.00%
- Batman Bad Seeds Gotham Central #1 — 63.15%
- Transformers #36 — 61.69%
- Punisher #8 — 59.66%
- Batman & Robin Year One Dynamic Duos #2 — 55.86%
- Doomquest #4 — 54.10%
- Fury Of Firestorm #6 — 49.07%
- Barbara Gordon Breakout #5 — 47.44%
- Clayface Celebrity Dirt #3 — 47.18%
- Challenges Of Doom Spider-Man #1 — 46.95%
The lower half of the top ten was particularly compressed. Positions seven through ten range from 49.07% to 46.95% of Spawn ’77 #1’s sales level, a spread of only 2.12 percentage points. That indicates a tight grouping within the ranking, although it does not reveal whether the actual difference in copies was large or small.
What point-of-sale data measures
Point-of-sale data is information recorded when a retailer sells an item through its sales system. In this case, it provides a view of comics sold by participating shops from Monday through Sunday, rather than only tracking what those stores initially ordered from distributors.
That distinction matters. An order chart and a point-of-sale chart answer related but different questions. Orders can show retailer expectations and inventory decisions before readers buy books. Point-of-sale reporting instead records sales that passed through the participating stores’ systems during the stated week. Neither measure, on its own, captures every possible way a comic can reach a reader.
The available data is specifically framed around the direct market, the network of comic shops that order comics for retail sale. It should not automatically be used to describe bookstore performance, digital sales, subscription services, convention sales, or sales made by shops outside the reporting sample. The report also does not supply raw sales numbers, returns information, issue prices, inventory levels, or a publisher-by-publisher explanation of which releases drove the percentages.
A close top two, and a strong third-place showing
The headline result is the tight DC-Marvel contest. DC’s 37.64% share placed it ahead for this week, but Marvel was only 2.43 points back. With a single seven-day window and a partial direct-market sample, the sensible reading is limited: DC led this measured period. It is not enough by itself to establish a lasting shift in the broader market.
Image’s 14.56% is equally important context. The publisher had the week’s best-selling comic with Spawn ’77 #1, and its overall share was more than four times IDW’s 3.02%, the next-highest publisher outside the top three. A chart-topping issue and publisher share are different measurements, however. One hit release does not mean every one of that publisher’s books sold at the same level, just as a publisher can achieve a large cumulative share through multiple titles without holding the number-one slot.
The top-ten list reflects that split in a compact way. It includes titles associated with DC, Marvel and Image, while the publisher market-share table encompasses a wider range of companies. Rankings of individual releases illustrate which single issues sold most strongly in the observed stores; market-share figures summarize each publisher’s overall portion of the reporting period.
How collectors and shop regulars can use the chart
For readers following new releases, the list is best used as a discovery and context tool. It identifies a group of books that found visible sales momentum in participating comic shops during a defined week. It does not establish rarity, future collectible value, print-run size, or a book’s long-term importance. Those claims would require details that are not included here.
For comic-shop customers, the most practical takeaway is that a strong weekly ranking may signal active demand for an issue, especially for a new number one such as Spawn ’77 #1. But a sales chart cannot confirm whether a nearby shop has stock, whether it reordered a book, or whether a title will be easy to find later. Calling or checking with a local retailer remains the direct route to availability.
For observers of the business, the data also demonstrates why methodology should travel with the headline. More than 600 participating stores is meaningful coverage, but it remains a subset of the estimated 1,800 to 2,000 direct-market stores. The results are valuable precisely as what they are: a transparent, time-bounded look at recorded retail sales from a large participating group. The close DC-Marvel race and Image’s chart-leading Spawn ’77 #1 are the week’s clearest signals, without requiring broader claims the numbers cannot support.