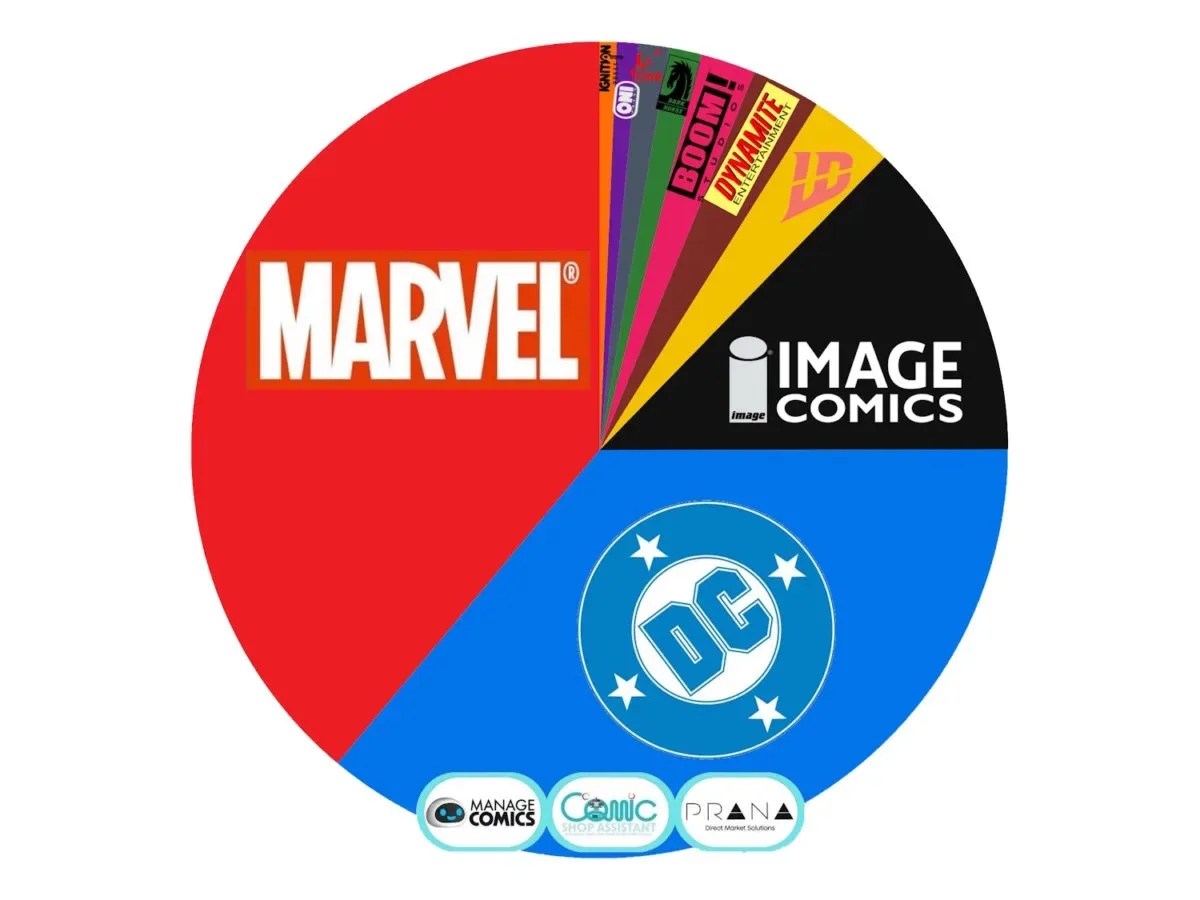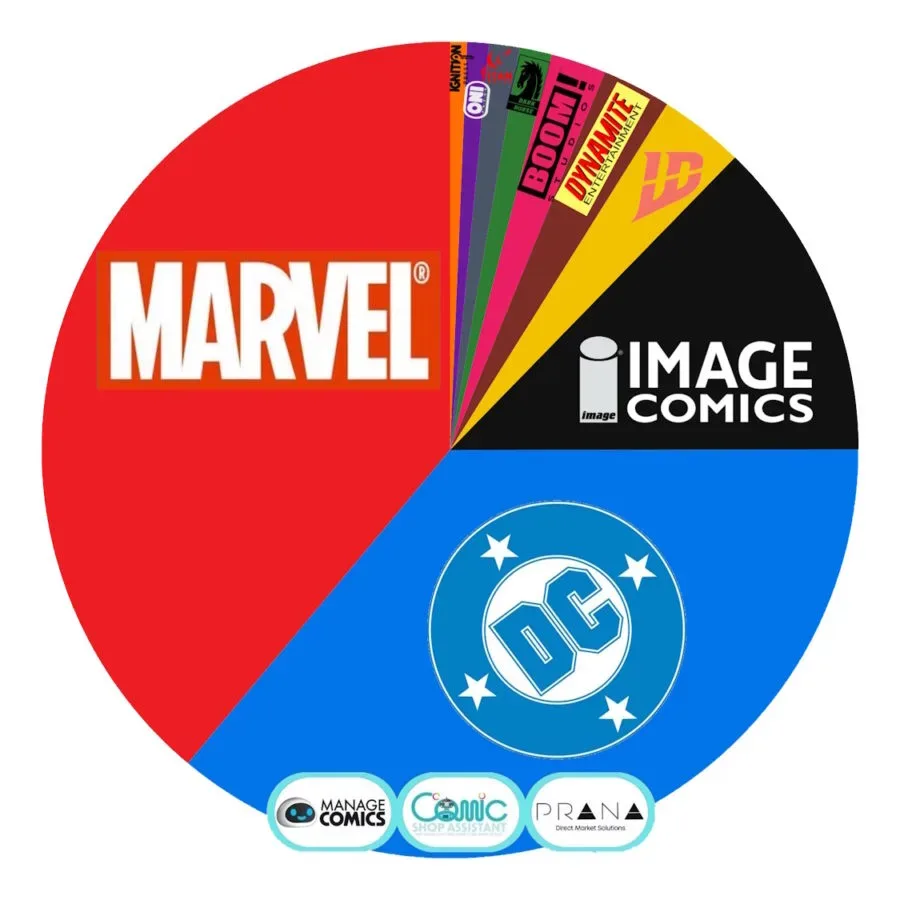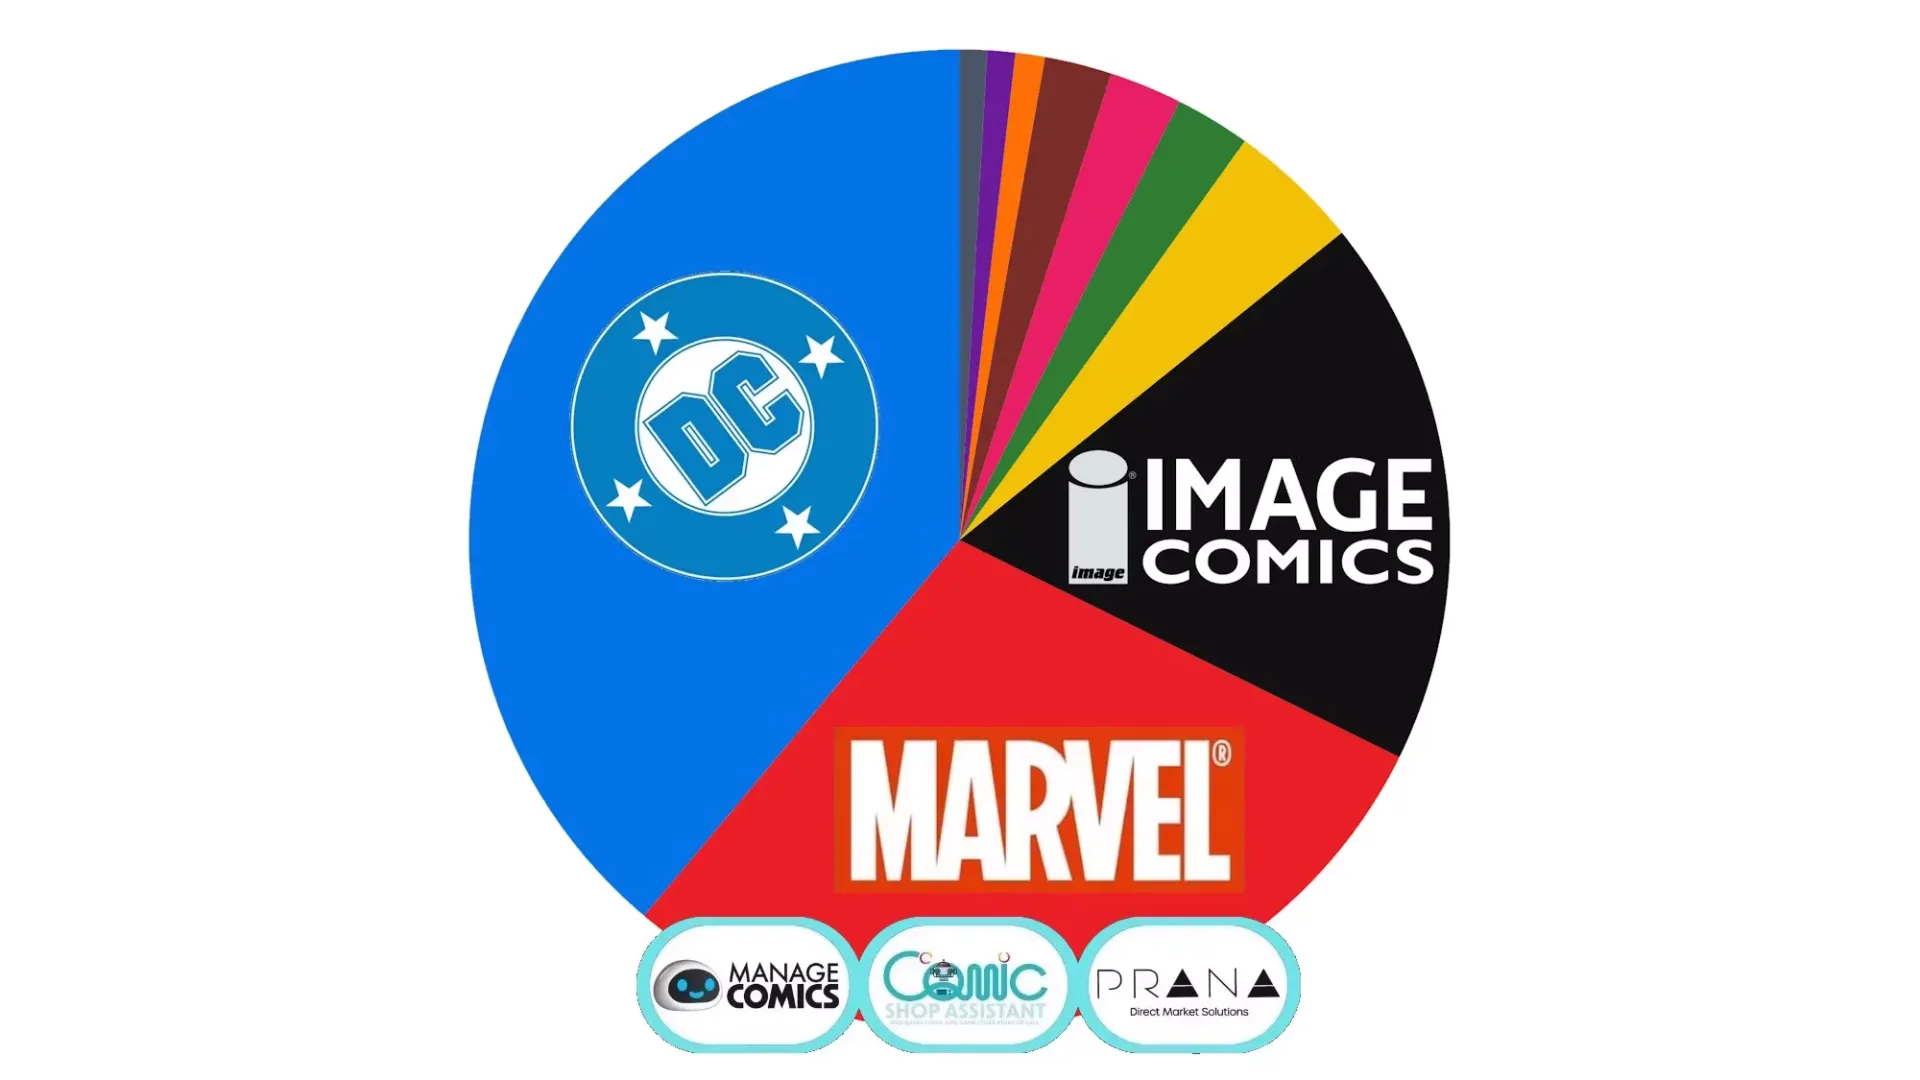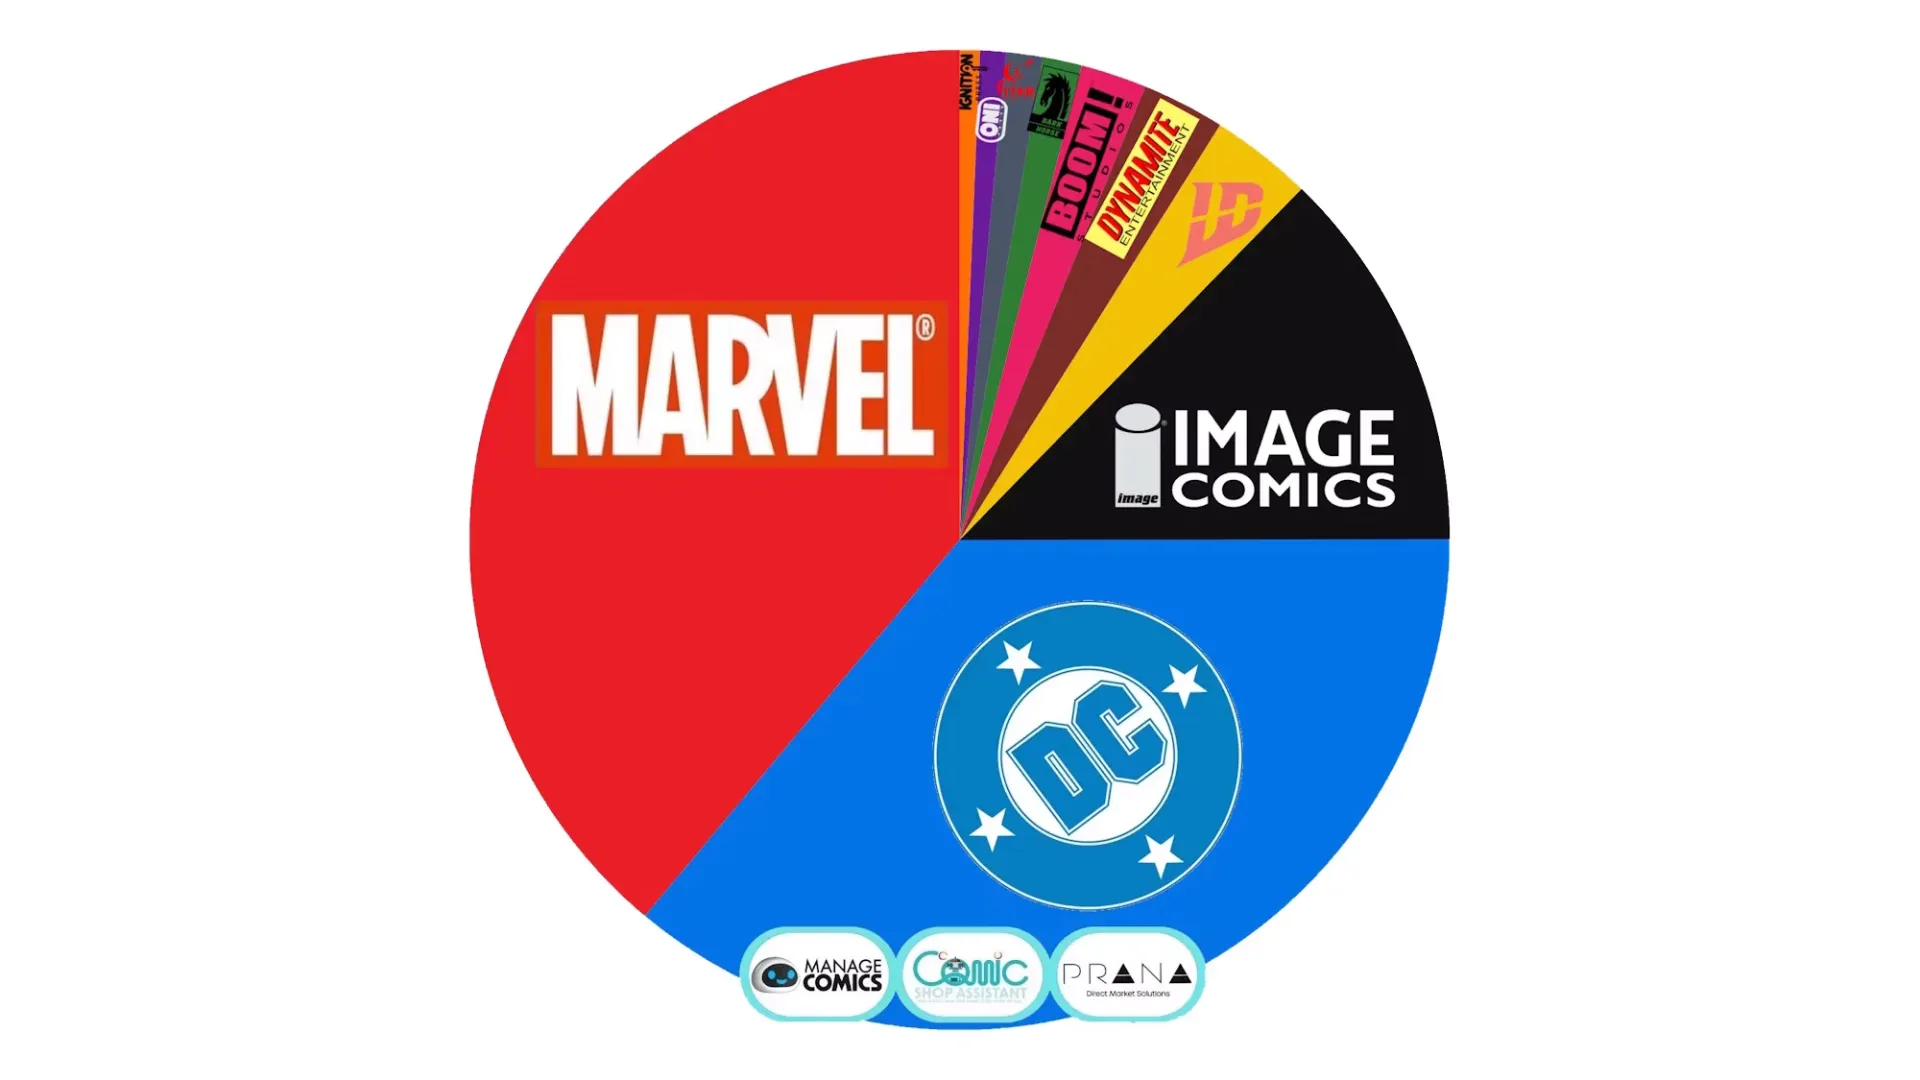

August 2026’s comic-shop data tells two true stories at once: DC sold the largest share of individual comics in the measured direct market, while Marvel captured the largest share of the money spent. The apparent contradiction is not a contradiction at all. It is a useful reminder that unit sales and revenue are different measurements, particularly when publishers have noticeably different cover-price mixes.
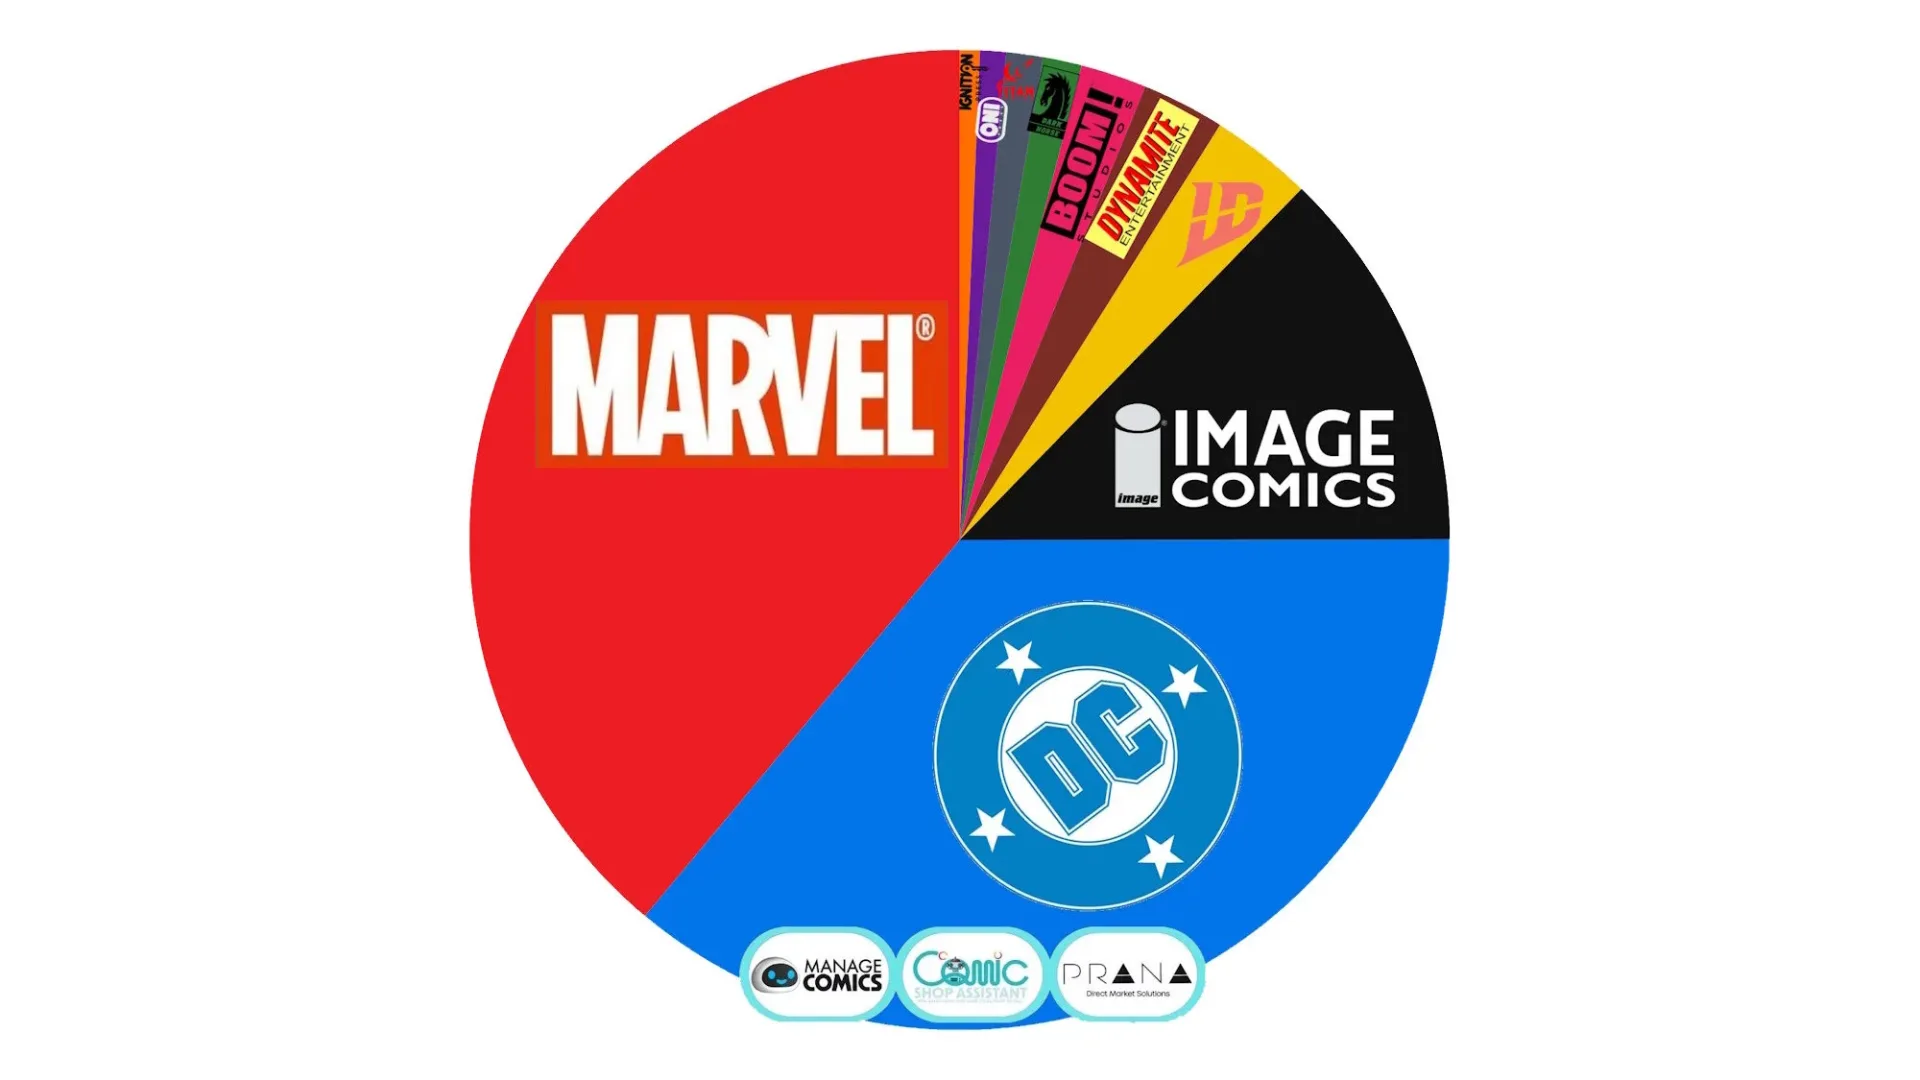
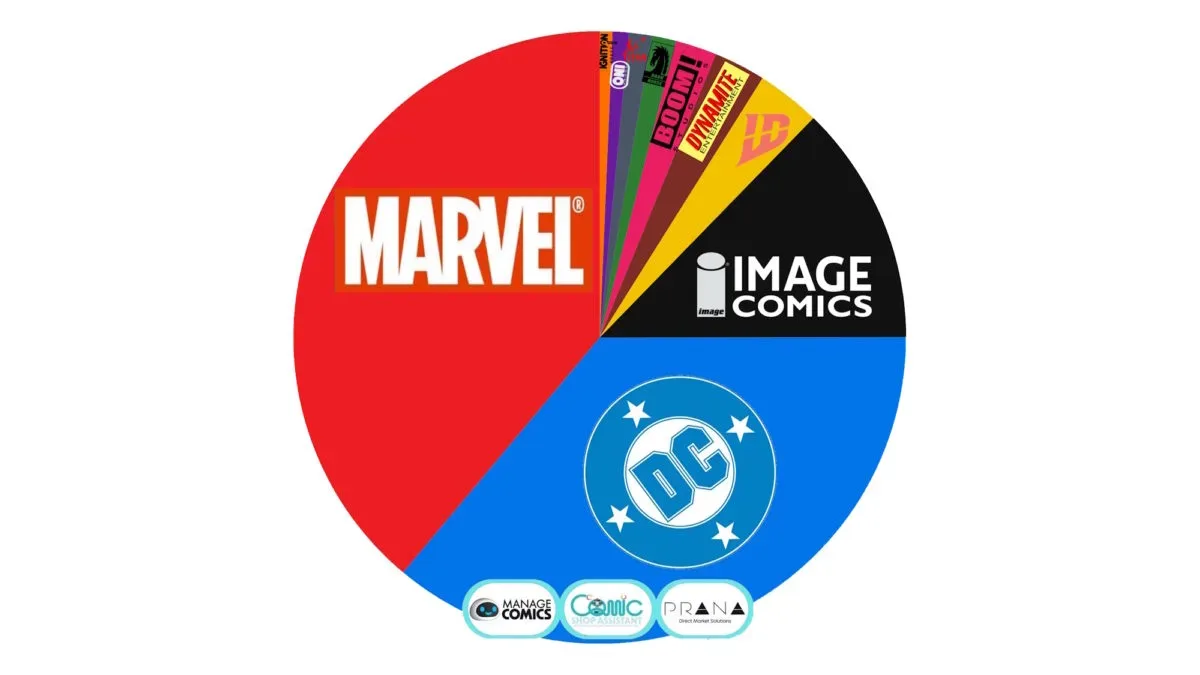
In the point-of-sale sample, DC held 38.89% of unit sales in August, ahead of Marvel at 28.81% and Image at 18.08%. Shift the question from “how many comics moved?” to “how many dollars did those comics represent?” and Marvel comes first at 38.03%, narrowly ahead of DC’s 35.30%. Image, meanwhile, falls from a formidable third-place 18.08% in unit share to 12.40% in dollar share.
That split has immediate relevance for readers watching the health of weekly comics, retailers ordering their shelves, and collectors trying to understand what a bestseller list does—and does not—say about demand. The month’s top title was Absolute Batman #23, and its lead helped anchor a top 10 packed with Batman and Absolute-line issues. But the publisher market-share picture is much broader than one chart-topping book.
August’s direct-market shares: copies versus dollars
Unit market share measures the proportion of copies sold by each publisher in the reporting sample. Under that measure, DC was comfortably first:
- DC: 38.89%
- Marvel: 28.81%
- Image: 18.08%
- IDW: 4.34%
- Dark Horse: 2.48%
- Boom: 2.39%
- Dynamite: 2.22%
- Ignition: 0.97%
- Oni: 0.92%
- Titan: 0.90%
DC’s advantage over Marvel is just over 10 percentage points here, while Image’s 18.08% stands out as a substantial third-place showing. In practical terms, this measurement is the most direct indicator in the data of which publishers’ single issues were scanned most often by participating comic shops during the month.
Dollar market share, by contrast, assigns weight to the cash value of those sales. On that basis, Marvel’s position changes dramatically:
- Marvel: 38.03%
- DC: 35.30%
- Image: 12.40%
- IDW: 3.29%
- Dynamite: 2.67%
- Boom: 2.13%
- Dark Horse: 1.25%
- Titan: 1.18%
- Oni: 0.84%
- Ignition: 0.65%
Marvel’s dollar share exceeds its unit share by 9.22 percentage points. DC’s dollar share is 3.59 points below its unit share, while Image’s is 5.68 points lower. Those differences should not be read as a verdict on the quality or desirability of any publisher’s books. They instead describe the combined effect of quantities sold and the prices attached to them.
Why Marvel’s dollar share runs ahead
The available pricing context points to cover price as the central explanation. Many Marvel comics are priced at $4.99 or more. Many DC comics remain at $3.99, although higher-priced DC releases include major books in the Absolute line as well as Batman and Superman. Image has an even greater concentration of $3.99 titles.
Put simply, a publisher can sell fewer copies but generate more sales dollars when its average sale is more expensive. A $4.99 comic produces more revenue per copy than a $3.99 comic before any other factors enter the calculation. Across a full month and a full catalogue, that difference can materially reshape the ranking.
This is why “Marvel beat DC” needs a qualifier. Marvel led the participating shops’ August results by dollar spend; DC led them by copies sold. Both statements are accurate. Neither one alone gives a complete description of the market.
For a comic-shop customer, that distinction may clarify why a publisher can look dominant on sales receipts without occupying the most spots in a stack of weekly purchases. For stores, it highlights a familiar balance: high-volume lower-priced comics can bring steady traffic, while higher-priced issues can account for a disproportionate share of the register total.
Absolute Batman #23 heads a DC-heavy top 10
Absolute Batman #23 was August’s leading single issue in the measured sales data, set to an index of 100.00%. The rest of the ranking is expressed relative to that leader rather than as confirmed raw copy totals. Batman #12 followed at 63.25%, and Absolute Green Arrow #4 took third at 49.43%.
- Absolute Batman #23 — 100.00%
- Batman #12 — 63.25%
- Absolute Green Arrow #4 — 49.43%
- Absolute Superman #22 — 39.23%
- Queen In Black #1 — 38.44%
- Absolute Catwoman #3 — 36.00%
- Amazing Spider-Man #34 — 32.45%
- Miles Morales Spider-Man #1 — 32.04%
- Absolute Wonder Woman #23 — 30.83%
- Batman Bad Seeds Sunset #1 — 30.09%
The list illustrates the strength of DC’s Batman-related catalogue and the Absolute line in unit sales. Five Absolute titles appear: Absolute Batman, Absolute Green Arrow, Absolute Superman, Absolute Catwoman, and Absolute Wonder Woman. Of those, Absolute Green Arrow #4 is the closest challenger to Absolute Batman #23, while still selling at less than half of the leader’s indexed figure.
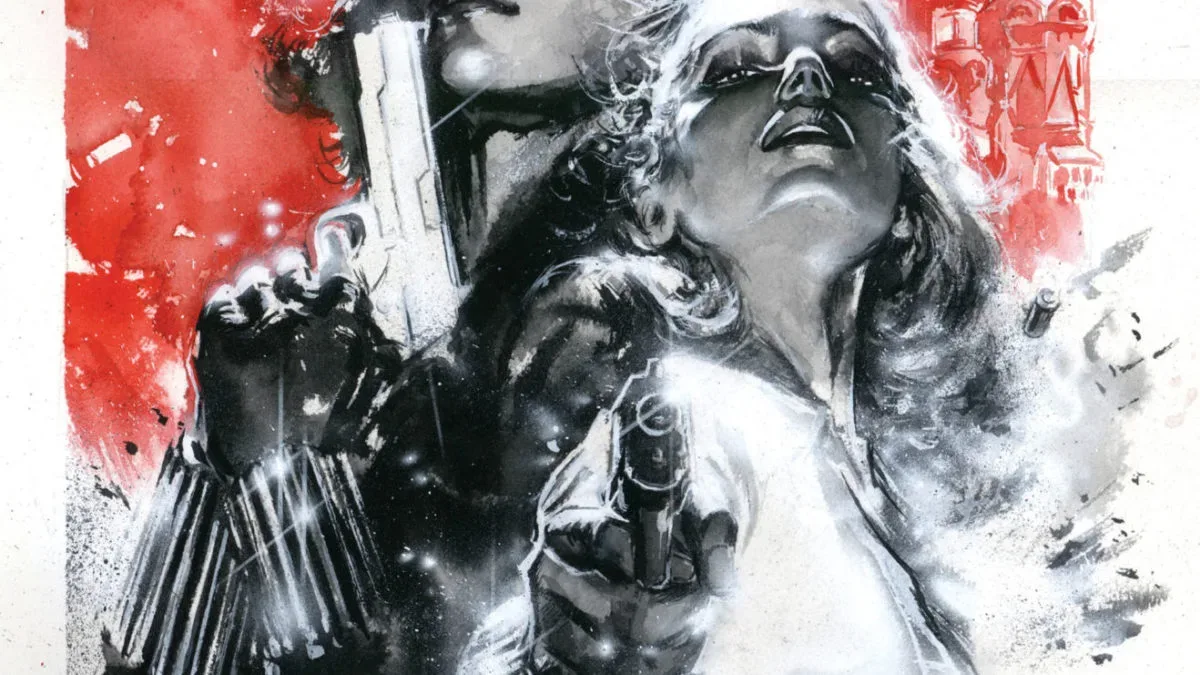
Marvel places three issues in the top 10: Queen In Black #1, Amazing Spider-Man #34, and Miles Morales Spider-Man #1. The new Miles Morales Spider-Man #1 is especially close to Amazing Spider-Man #34 in the index, only 0.41 percentage points behind. For readers following Marvel’s wider publishing slate, the company also has a new Black Widow: Black, White & Red Room anthology centered on Natasha, Yelena, and Nadia.
What the percentages can—and cannot—tell us
It is tempting to turn an indexed ranking into a precise sales estimate, but the underlying chart does not publish verified total copies for the leading issue. The percentages establish the titles’ relationship to Absolute Batman #23. They tell us, for example, that Batman #12 registered 63.25% of the leader’s measured sales. They do not independently establish that either issue crossed a particular nationwide circulation total.
One illustrative calculation assumes Absolute Batman #23 sold 500,000 copies and applies each title’s index to that assumption. Under that scenario, Batman #12 would be 316,250 copies, Absolute Green Arrow #4 would be 247,150, and Miles Morales Spider-Man #1 would be 160,200. These are hypothetical extrapolations, not confirmed sales figures. Change the starting assumption for Absolute Batman, and every estimated total changes with it.
That caveat matters for collectors and observers. A high rank is meaningful evidence of relative performance in the data set; it is not, on its own, proof of scarcity, future value, or an exact print quantity. Those are separate questions, and the supplied numbers cannot answer them.
How broad is the data sample?
The figures come from point-of-sale records collected through Manage Comics and Comic Shop Assistant systems at more than 600 comic shops. Point-of-sale data means actual transactions recorded at participating stores, rather than merely distributor orders placed in advance. The weekly collection window runs Monday through Sunday.
More than 600 stores is meaningful coverage, but it is not the complete direct market. The supplied context estimates that roughly 1,800 to 2,000 shops currently order through that market. Therefore, these results should be treated as a substantial sample of participating retailers, not a definitive census of every direct-market store and every order channel.
That limitation also helps explain why precision matters in the language around the ranking. The chart is well suited to identifying sales patterns among its reporting shops: DC’s powerful unit performance, Marvel’s pricing-supported revenue lead, Image’s large unit contribution, and the visibility of the Absolute books are all clear. It is less suited to making absolute claims about every comic store, every reader, or exact industry-wide totals.
The practical read on August
August’s results show a market with two distinct competitive advantages. DC had breadth in copies sold, led by Absolute Batman #23 and reinforced by a deeply DC-leaning top 10. Marvel had greater dollar yield, with a higher-priced mix turning a 28.81% unit share into a 38.03% share of spending.
Image’s numbers offer another useful lesson: 18.08% of units is an important share of the comics bought in the sample, even if the publisher’s 12.40% dollar result reflects a catalogue more commonly priced at $3.99. Lower dollar share should not be mistaken for negligible shelf presence; in August, Image remained far ahead of every publisher outside the DC-Marvel pair in copies sold.
For readers, the clearest takeaway is modest but important: bestseller charts are not interchangeable. Check whether a report is counting copies, sales dollars, orders, or another metric before using it to judge momentum. In August 2026, that one methodological detail is the entire story behind Marvel taking the money lead while DC remains the volume champion.