
Physical game sales have produced an unusual headline in the United States: consumer spending on new physical software is up 5% year over year so far in 2026. On its face, that sounds like an emphatic comeback for boxed games. The underlying figures tell a narrower, more complicated story.
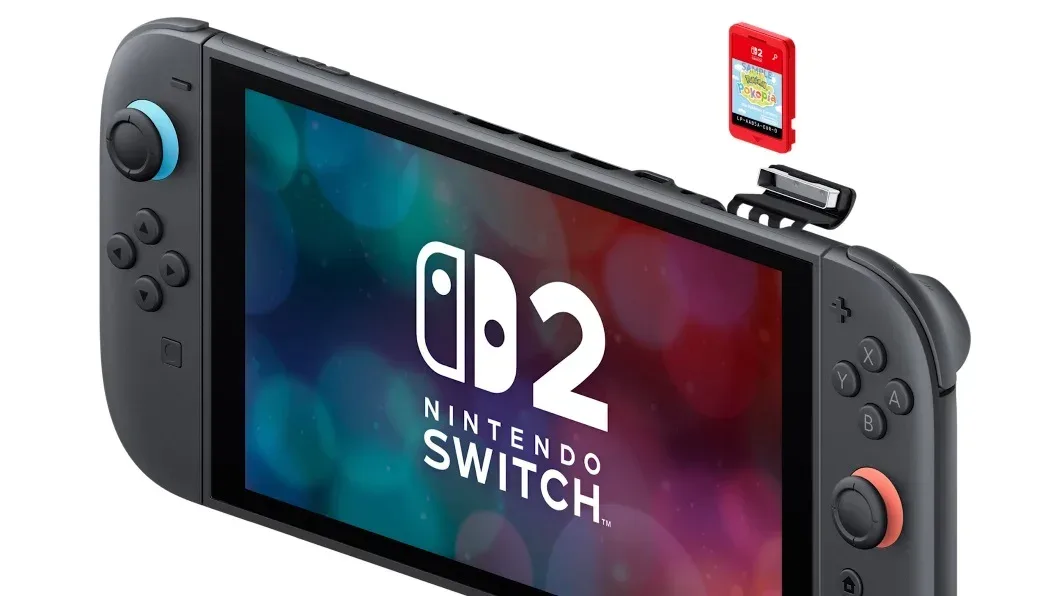
The growth is being propelled primarily by Switch 2 game-key cards. Spending on those products rose 631%, while spending on all other new physical software fell 3%. That does not mean one kind of boxed product suddenly became six times more popular on a like-for-like basis. It reflects a far larger selection of game-key card releases this year: 10 titles were published in that format last year, while 54 additional titles have arrived in 2026.
In other words, the big percentage is substantially a story of catalogue expansion. Consumers cannot spend money on a format that has few releases, and publishers have supplied dramatically more of them for Switch 2. The resulting 5% gain is still meaningful—new physical software spending is growing for the first time in more than a decade—but it should not be mistaken for proof that every part of the traditional physical market is moving upward.
Why 631% growth needs context
Percentage changes can be useful, but they can also look more explosive than the market change behind them. A category starting from a small base can post an enormous rise when its number of products grows rapidly. Here, the release count is crucial context: the number of game-key card titles increased sharply compared with the prior year.
That makes the 631% spending increase easier to interpret. More game-key cards were available, and the Switch 2 is a new platform with buyers looking for software. The format’s rise is therefore tied to both supply—the larger slate publishers elected to release—and demand from a current console audience.
The important counterweight is the 3% decline in everything outside game-key cards. Taken together, the figures describe a physical-software category that is being reshaped by one platform and one increasingly used retail format, rather than a blanket reversal in the fortunes of discs, cartridges, or packaged games across the market.
What “physical software spending” measures
The wording matters. Spending is the money consumers put toward products, not necessarily the number of copies sold. A spending increase can come from higher unit sales, higher average prices, a different mix of releases, or several of those factors at once. The supplied data supports the conclusion that the wider game-key card assortment is a major driver; it does not establish how many individual cards were sold or what portion of the growth came from price and product mix.
That distinction appears elsewhere in the August results. Hardware dollar sales and hardware unit sales moved in different directions, demonstrating why revenue alone should not be read as a direct count of systems purchased.
Related coverage includes U.S. Physical Game Spending Rises in 2026 as Switch 2 Game-Key Cards Surge.
August overall: content spending falls despite a busy release month
The physical-game result sits inside a softer overall U.S. games spending picture for August. Total spending fell 9% year over year to $4.3 billion. Content spending for the month declined 10%, with mobile spending described as the main cause. Console content spending also fell, while PC content spending and subscription spending increased.
That split is a useful reminder that the games business is not one single market. Physical retail software, console content, PC content, subscriptions, mobile spending, accessories, and hardware can all move in different directions over the same period. A positive physical-software figure does not automatically lift total content spending, especially when mobile and console content categories are down.
August nevertheless had prominent new releases near the top of the charts. NBA 2K27 was the month’s best-selling game, followed by Madden NFL 27, Marvel Tokon: Fighting Souls, Madden’s Kickoff Bundle, and Star Wars Zero Company. NBA 2K27 also reached third place among the year’s best-selling games to that point.
The leaderboard gives a snapshot of how a busy launch window can concentrate attention around major releases. It does not, on its own, explain the market-wide decline in content spending; the reported drop was chiefly associated with mobile spending, while console content was also down. But it does show that individual releases can still post strong results in a month when the overall category contracts.
Catalog movement shows platform launches and promotions still matter
Several older or previously lower-ranked games made notable jumps in August. Elden Ring climbed from No. 41 in July to No. 7 in August following its Switch 2 release. That is a particularly relevant example alongside the physical-sales story: a release on a new platform can create a fresh burst of demand for a game that had already been available elsewhere.
Marvel’s Spider-Man 2 rose from No. 31 to No. 11, with momentum linked to interest around a recent film. Kingdom Hearts Integrum Masterpiece jumped from No. 159 to No. 26 after major D23 reveals and a Steam sale. For readers thinking about revisiting the series, a look at replaying Kingdom Hearts and its famously tangled story provides useful context for why renewed franchise attention can matter.
These movements are not identical cases. Elden Ring’s gain is associated with a Switch 2 release, Marvel’s Spider-Man 2 with film-related enthusiasm, and Kingdom Hearts Integrum Masterpiece with event reveals and a sale. Their shared lesson is more modest: sales charts are responsive to new access points, promotional activity, and wider entertainment attention. A chart position is a result, not a single-cause diagnosis.
Big Walk also entered the top 10, an impressive placement for an indie game in a month packed with large new launches. Its presence underlines that major franchises did not entirely monopolize August’s purchasing activity.
Hardware revenue and hardware units tell different stories
Hardware spending fell 3% in August, while accessory spending rose 3%. Within hardware revenue, PlayStation 5 dollar sales increased 17%. Xbox and Switch 2 hardware spending each dropped 13%, offsetting the PS5 gain.
Those are dollar figures, and therefore include the effect of what people paid. Unit sales paint a harsher picture: total hardware units declined 15% year over year, the weakest August total since 2013. PlayStation hardware units were down 11%, also the lowest August level since 2013. Xbox units fell 31%, the lowest August result since 2020, while Nintendo units were down 15%.
The average price of a new hardware unit was $541. That figure helps explain why a revenue result can look relatively resilient even when unit demand weakens. If fewer systems are sold but the average amount paid per system is higher, dollar sales can fall less sharply than unit sales—or, in a platform-specific case, potentially rise. It is not appropriate to treat the PS5’s 17% gain in dollar sales as evidence that unit sales rose, because the reported figures do not say that.
What the physical increase does—and does not—say
The most defensible reading of the data is that physical retail has found a current growth pocket around Switch 2 and game-key cards. That is notable because it has helped new physical software spending rise for the first time in more than a decade. It also gives publishers evidence that retail packaging remains commercially relevant to at least part of the current console audience.
But the figures do not settle broader arguments about preservation, ownership, download requirements, or the long-term health of physical media. They measure U.S. consumer spending on new physical software. They do not establish whether every buyer prefers physical releases, whether all physical formats are recovering, or how the products function after purchase. Nor do they override the 3% decline in non-game-key-card physical software spending.
For shoppers, the practical takeaway is simple: a physical box or card is not, by itself, a complete description of the product. The format named on the package matters, and buyers who have a specific preference about their library should check the release details before purchasing. For the market, the bigger takeaway is that format availability can materially affect the numbers. Add dozens of releases to a new hardware ecosystem and a category that looked stagnant can grow—without the rest of the physical business necessarily following at the same pace.
So physical games are not staging a simple, universal return. Rather, 2026’s data shows a more specific reality: Switch 2 has created an active retail opportunity, publishers are increasingly using game-key cards to participate in it, and that change in product availability has been large enough to move the national physical-software spending total upward.