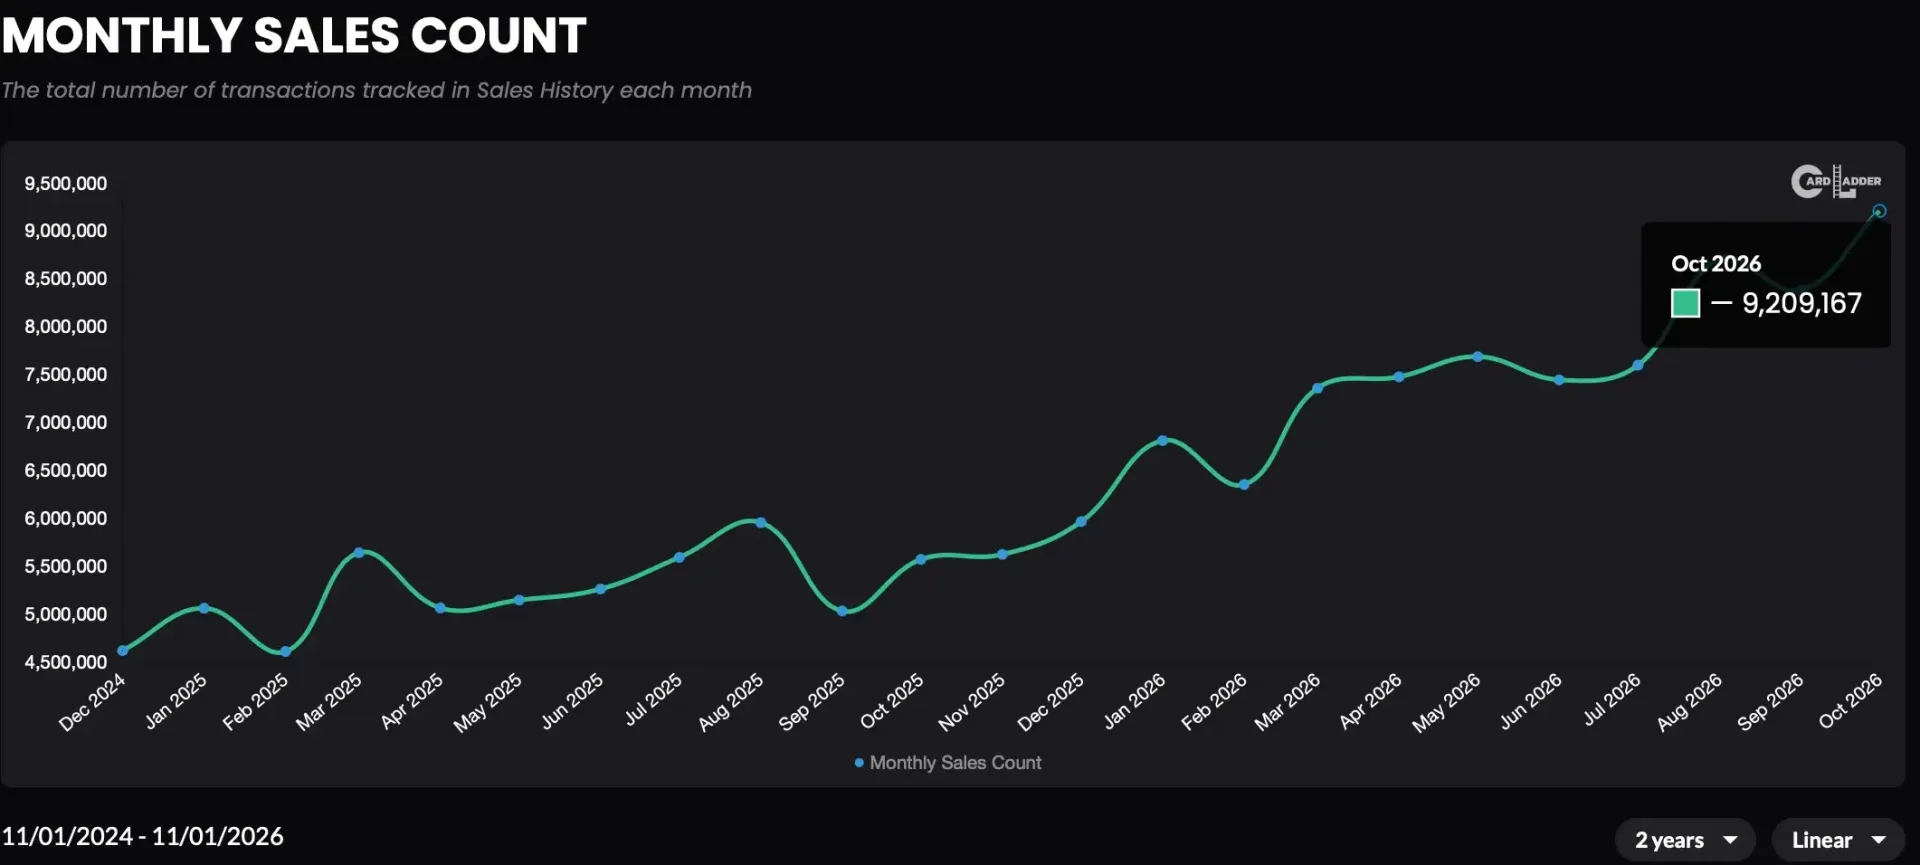
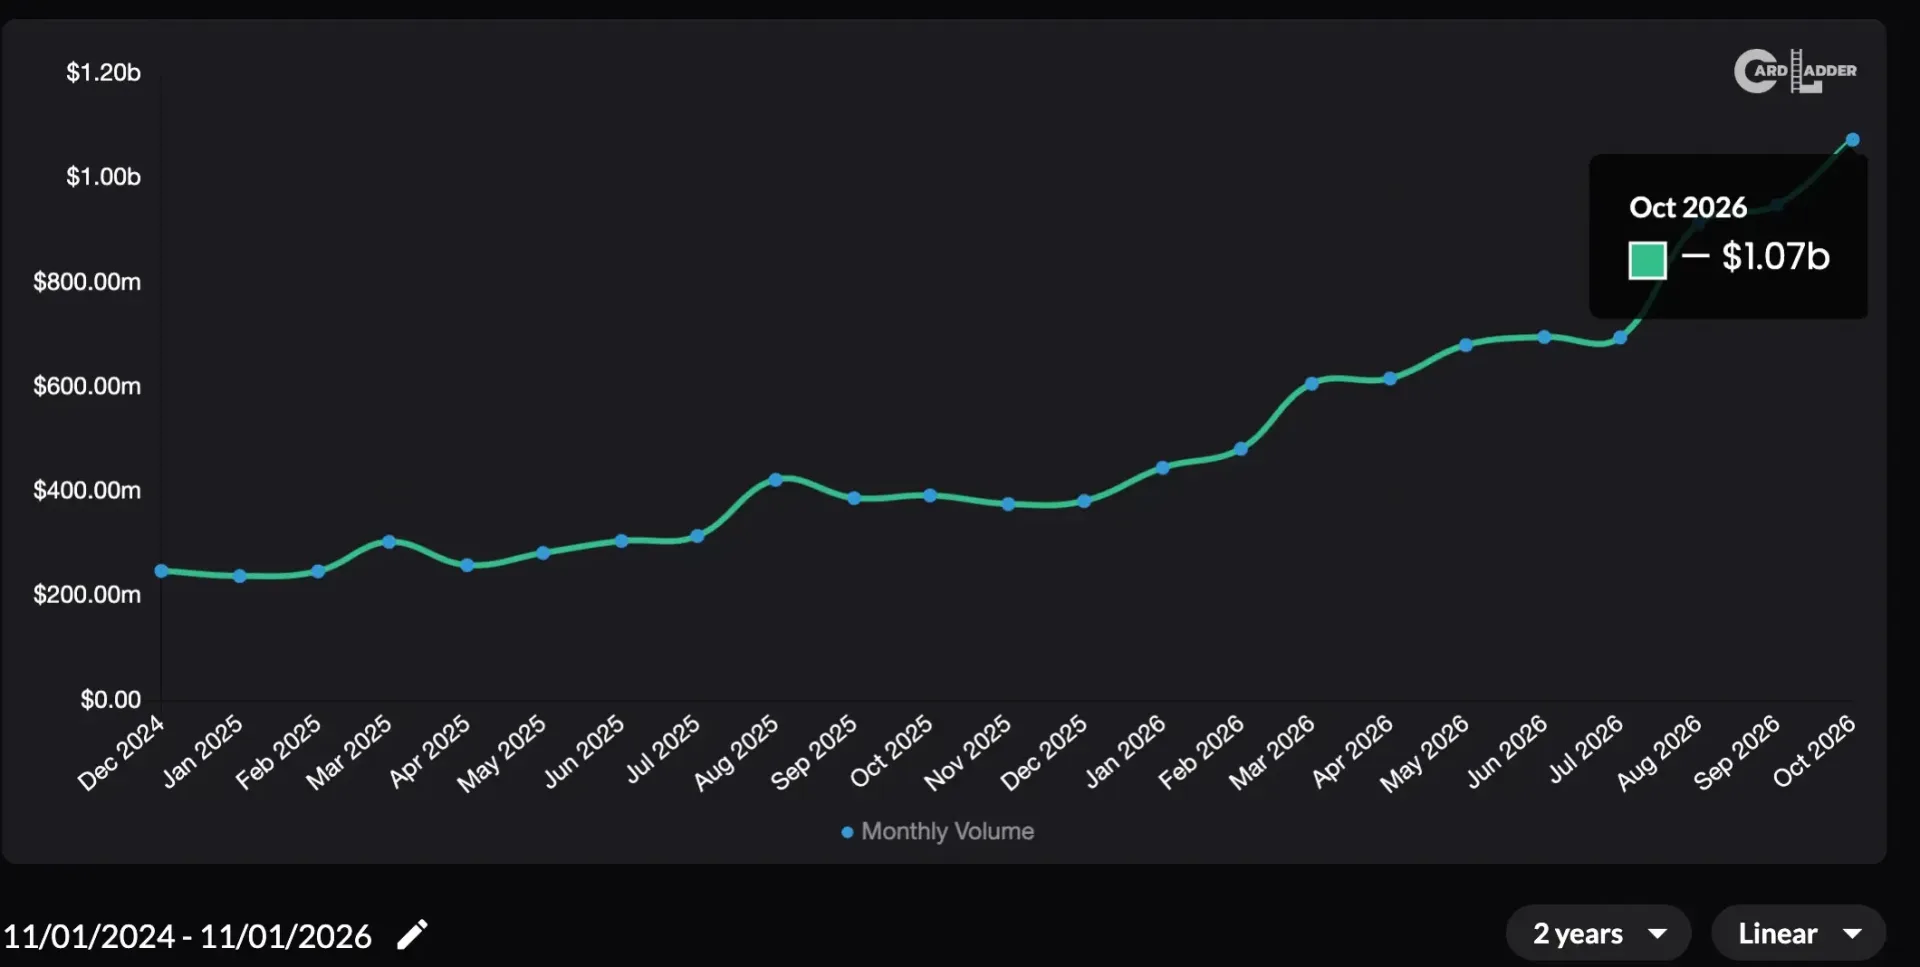
The trading-card market crossed a striking threshold in October 2026: tracked sales reached $1.07 billion for the month. The number is attention-grabbing on its own, but the fuller picture is more interesting than a handful of trophy-card auctions. More than 9.2 million transactions contributed to the total, while Pokémon and other trading card game categories continued to generate substantial activity alongside marquee baseball and basketball sales.
That combination matters. A market can make headlines through a single exceptional auction, but it becomes more durable only when there are large numbers of buyers and sellers transacting across many price points. October’s reported average sale price was about $116. The resulting picture is not merely one of ultra-expensive rarities changing hands; it is a market with considerable volume at accessible, everyday collecting levels as well.
A milestone built on a rising 2026 trend
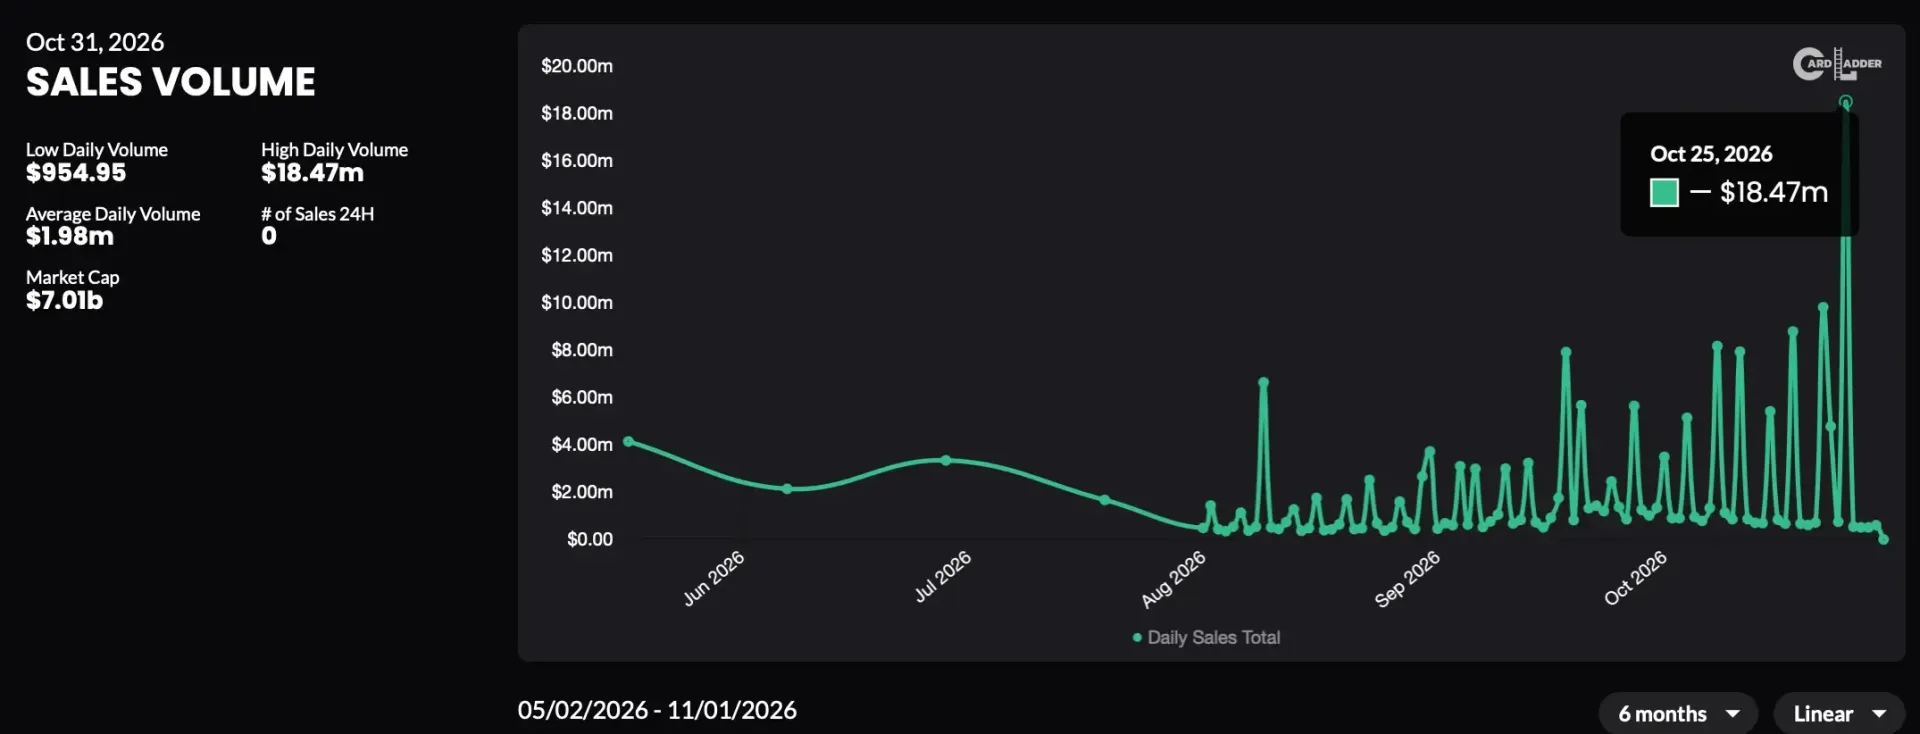
October did not emerge from nowhere. Tracked card sales totaled $445.06 million in January 2026, then rose to $912 million in August before reaching $1.07 billion in October. Those figures indicate a powerful upward trajectory across the year, following a broader growth trend visible over the prior two years.
Monthly sales volume is a useful measure of activity, but collectors should be precise about what it does and does not show. Volume is the aggregate dollar value of completed sales tracked by a marketplace-data service. It can rise because more cards sell, because average prices increase, or because both happen at once. October appears notable on both the dollar-volume and transaction-count fronts, though that still does not mean every card, set or genre appreciated at the same rate.
For more context, explore Top 10 Game Boy Advance RPGs Ranked by How They Reimagine Console-Scale Role-Playing for a Handheld.
For collectors, the practical takeaway is that the billion-dollar headline should not be treated as a universal price guide. A widely traded modern card, a scarce Japanese promotional card and a one-of-one sports card operate in dramatically different supply-and-demand environments. The headline establishes the scale of activity; card-specific research remains essential when buying, selling, grading or setting insurance values.
9.2 million transactions are the foundation beneath the big sales
October set a reported record with more than 9.2 million transactions, roughly half a million above August, the next-highest month. That scale helps explain why the $1.07 billion total is more than an auction-house story.
A transaction count captures the number of individual sales rather than the dollar amount. It is especially valuable here because it shows participation. A few multimillion-dollar cards create a huge amount of publicity, but they cannot account for a month containing millions of completed deals. At an average sale around $116, October’s market included enormous numbers of routine purchases: singles for binders, graded cards, lower-cost vintage, modern pulls, sports cards and other collectible categories.
High transaction volume can make a market easier to observe, too. More completed sales can produce more recent comparable prices for commonly traded cards. That does not eliminate uncertainty—condition, grading company, language, edition, autograph quality and scarcity can all materially change value—but it gives buyers and sellers a larger pool of evidence than a market driven only by occasional private transactions.
It also reinforces an often-overlooked point: headline records need a functioning middle. The hobby’s most expensive cards pull attention toward individual collectors, athletes, characters and one-of-one designs. Millions of smaller deals are what keep the broader ecosystem moving between major auctions.
Pokémon’s contribution went beyond one exceptional card
Pokémon and other TCGs were major contributors to October’s activity. Pokémon cards occupied three of the five highest-value sales cited for the month, and the category recorded more than $18 million in sales on October 25 alone. The data also arrives during Pokémon’s 30th-anniversary celebration, an event that likely increased attention on the franchise, though a single month of sales cannot establish a precise cause-and-effect relationship.
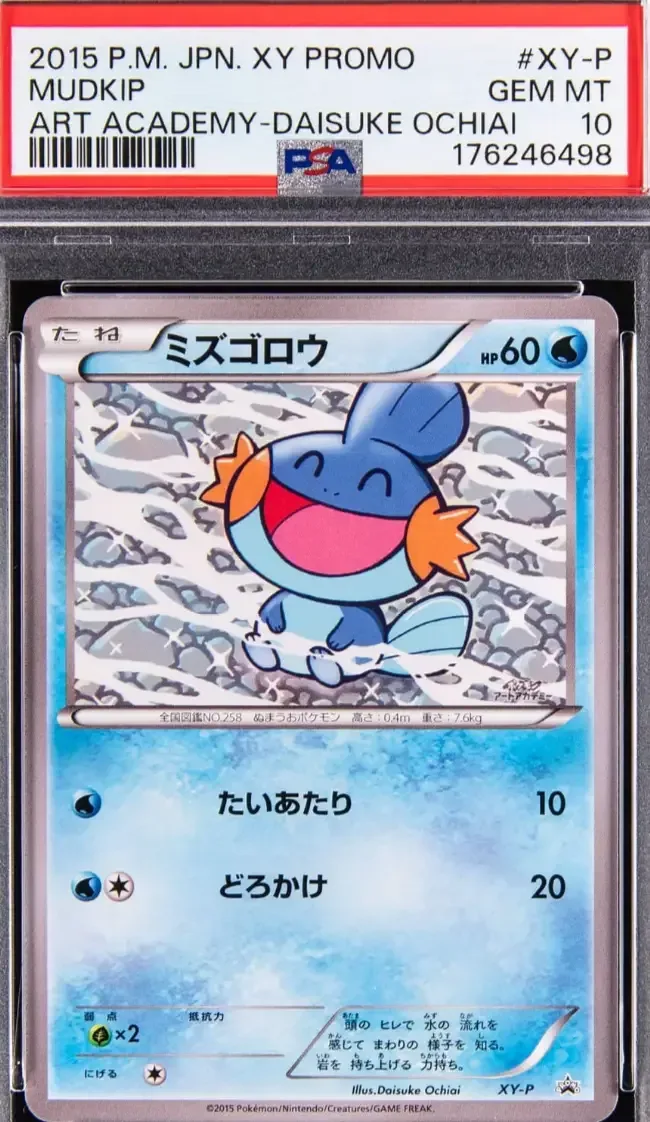
The month’s biggest reported TCG sale was a 2015 Japanese XY Promo Art Academy Daisuke Ochiai Mudkip graded PSA 10, which sold for $4.88 million through Goldin on October 26. In grading terminology, a PSA 10 is the highest numerical grade on PSA’s familiar 1-to-10 scale, indicating a card judged to be in Gem Mint condition under that company’s standards. The grade is not the sole source of a card’s appeal, but on unusually scarce and sought-after cards, the combination of rarity, subject, origin and top condition can be decisive.
The card’s Art Academy designation is also important context. Promotional cards are not necessarily distributed through ordinary booster-pack channels, and unusual distribution can create a scarcity profile very different from a standard set card. Collectors weighing a high-end sale should therefore avoid reducing its value story to the featured Pokémon alone. The exact issue, print and distribution circumstances, condition, authentication and population at a given grade all matter.
October’s Pokémon numbers point to strength at two very different levels: a multimillion-dollar top-end collectible and a daily category total in excess of $18 million. That is a broader signal than one sale in isolation. Even so, collectors should distinguish category-wide turnover from the prospects of any individual card. Popularity can raise demand, while new supply, grading submissions and shifts in collector taste may affect particular issues differently.
Sports cards remained central to the month’s largest results
Pokémon did not monopolize the high end. Baseball and basketball cards also appeared among October’s top sales, demonstrating that the market’s milestone was shared across major collecting segments.
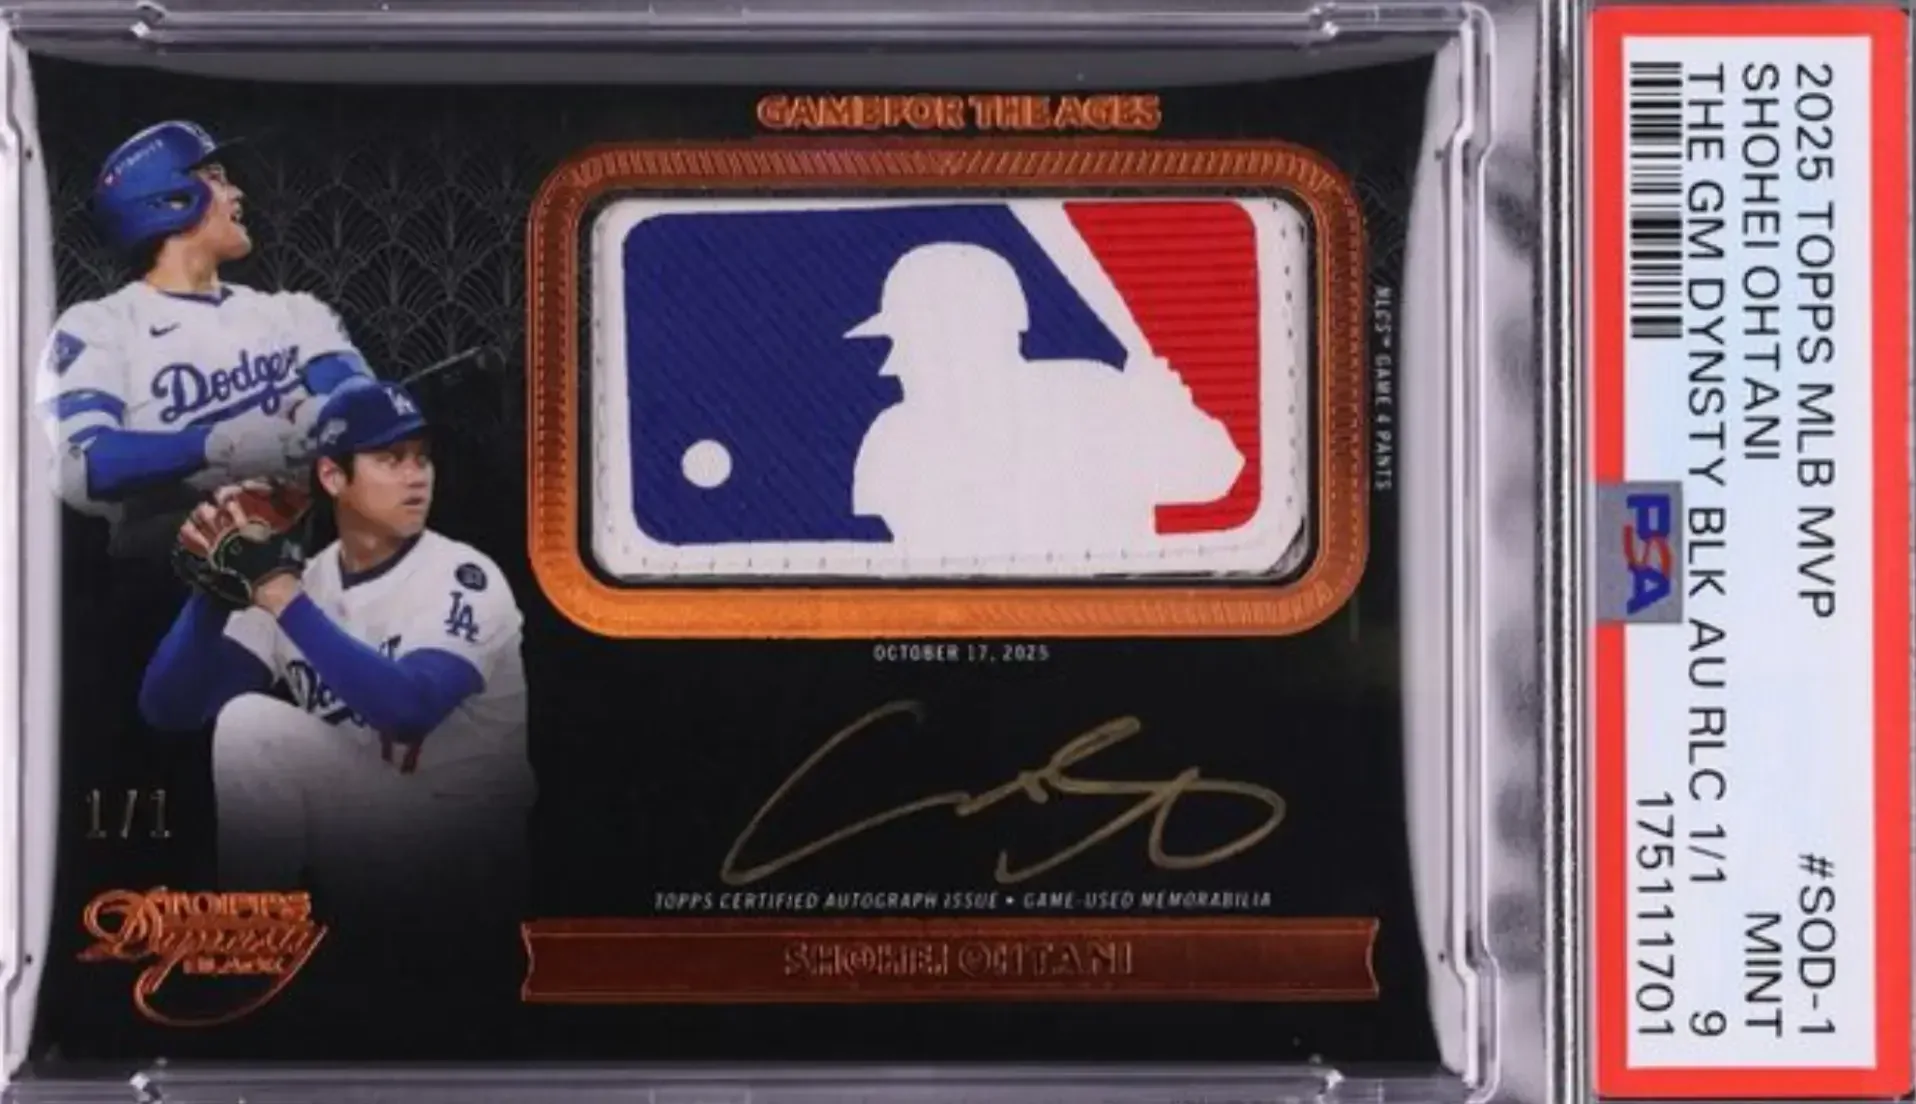
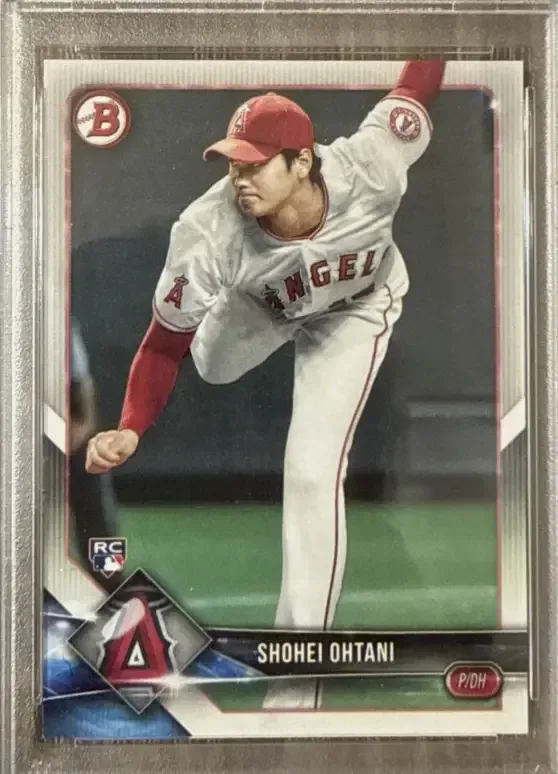
A 2025 Topps The Game Dynasty Black Logoman Auto /1 Shohei Ohtani, graded PSA 9, sold through Fanatics Premier on October 23. The reported material contains two different totals—$3.24 million in one listing and $3.42 million in the sale information—so the exact final figure should be treated as unresolved here. What is clear is that the card was reported as a multimillion-dollar October sale.
Its description packs several hobby terms into a short line. /1 means the card is serial-numbered as a one-of-one, signaling that just one copy exists within that stated release. Logoman refers to a card incorporating a league-logo patch. Auto means it carries an autograph. Those features concentrate scarcity and presentation into a single item, which helps explain why one-of-one memorabilia-autograph cards frequently surface at the top of sports-card sales lists.
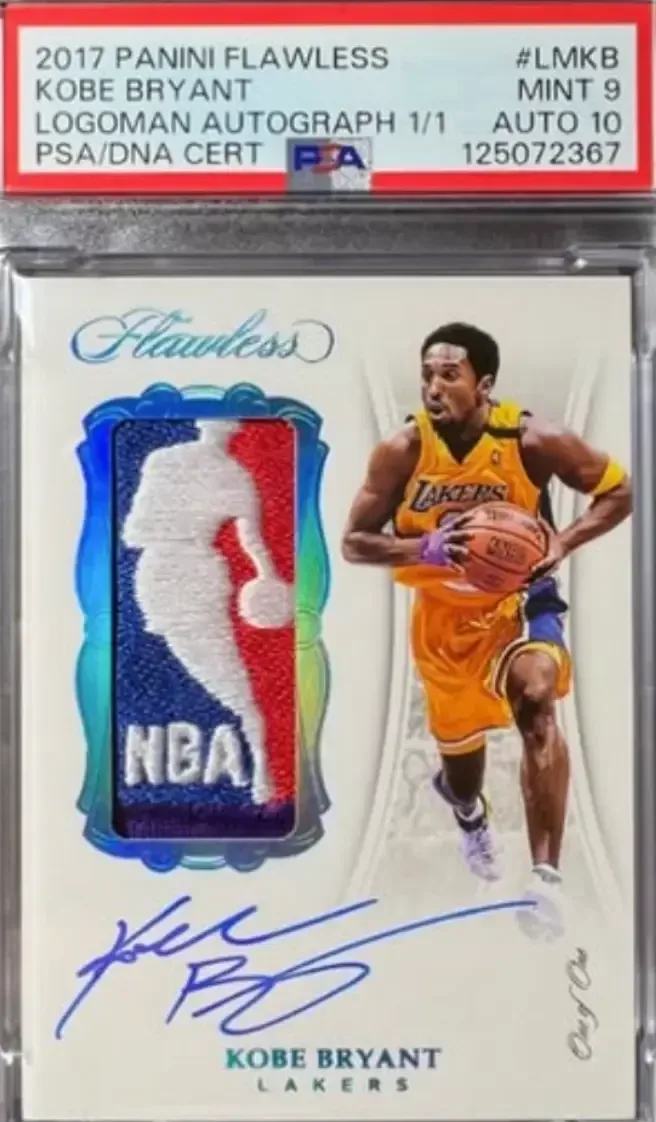
A 2017 Panini Flawless Logoman Auto /1 Kobe Bryant card, graded PSA 9 with an Auto 10 designation, was also publicly reported as a $4.2 million private sale on October 28. However, that result had not yet been verified in the tracking data. That qualifier is essential. Private sales can be meaningful market events, but verification is particularly important when using them as pricing evidence because the public record may be less complete than for a completed public auction.
Collectors should not treat an unverified private-sale report as interchangeable with a confirmed comparable. It may later be substantiated, but until then it is best regarded as a reported data point rather than settled market evidence. That distinction is not nitpicking; it is the difference between an exciting claim and a confirmed reference price.
Gains were spread across more than a few niches
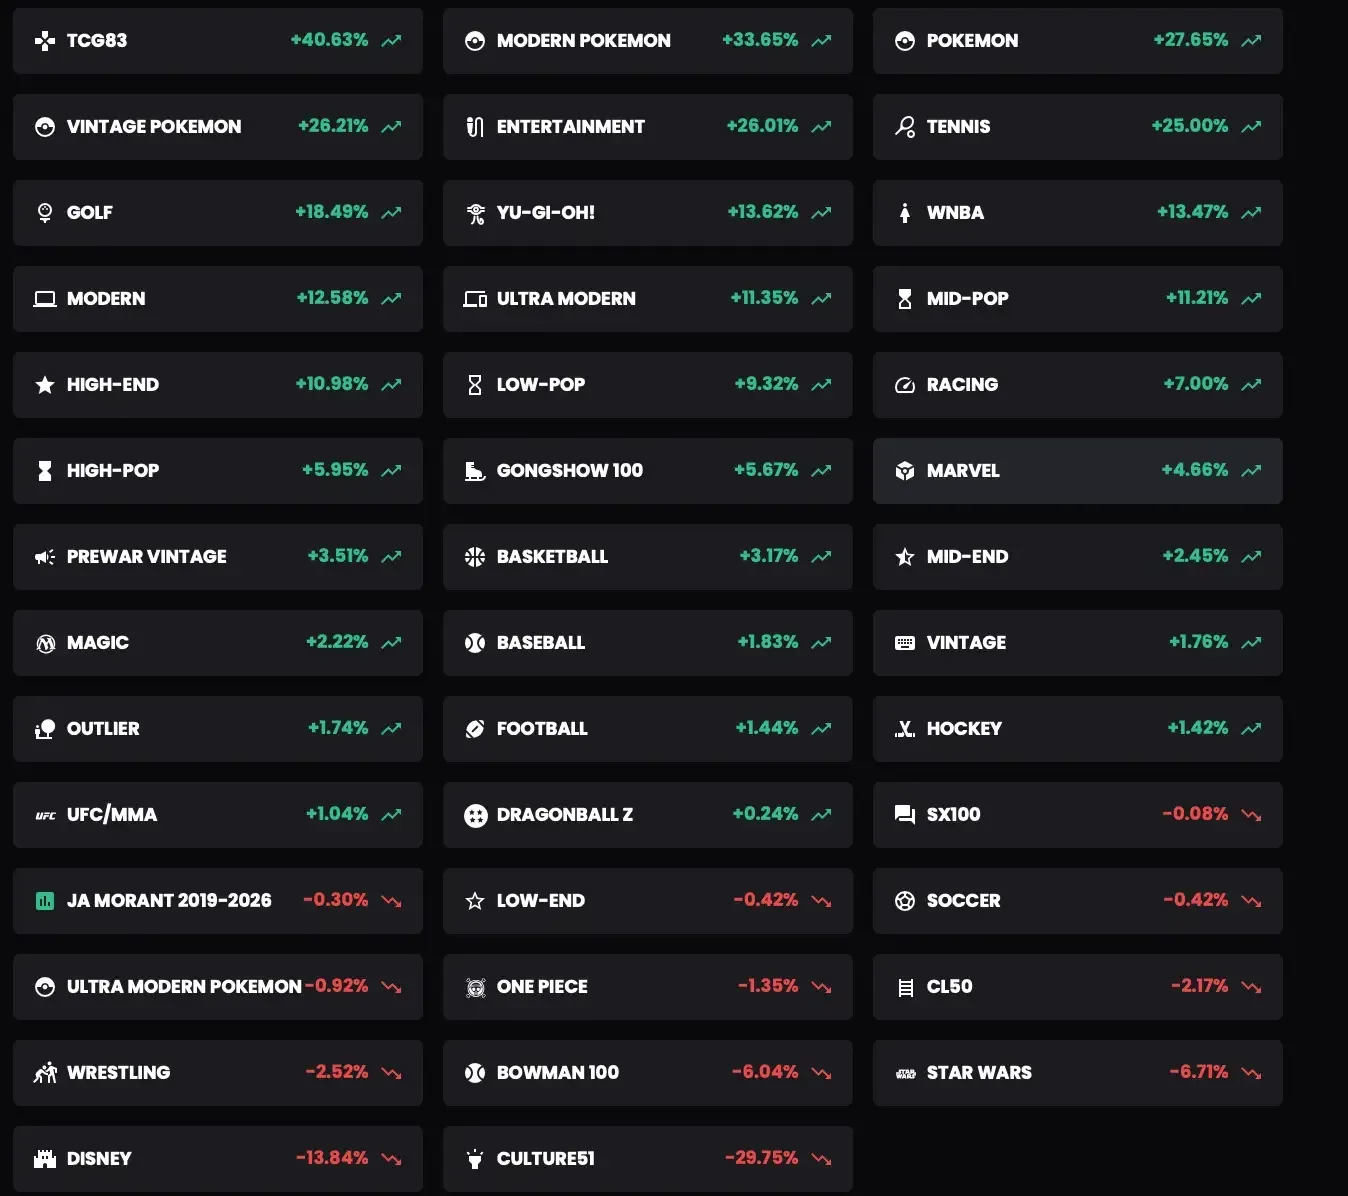
The broadest encouraging indicator was the distribution of monthly gains. Of 42 tracked market segments, 30 were up and 12 were down. Only five of the declining segments were down by more than 1% over the prior month.
An index is a grouped measure intended to track price movement across a defined selection of cards. It is useful for observing direction in a category, but it is not a promise that every included card rose by the same percentage, much less that every card outside the index did. A green month across 30 segments therefore suggests breadth, not uniformity.
That breadth helps contextualize the billion-dollar result. The biggest individual lots came from Pokémon and sports cards, but the index picture indicates that activity and price movement were not confined to those headline names alone. For a collector deciding whether to act, though, category-level momentum is only a starting point. Checking actual recent sales for the precise card and comparable condition remains more informative than relying on a broad market color code.
What the record does—and does not—say about the future
October’s total establishes a major moment for trading cards, but it cannot answer how long the expansion will last. Market growth can be affected by collector confidence, internal controversies that harm trust, inflation and shifts in broader investment conditions. When household budgets tighten, discretionary collectibles may face pressure.
The sensible reading is neither that every card has become a guaranteed investment nor that the milestone is somehow meaningless because conditions can change. Instead, the data shows a highly active October with record transaction activity, meaningful TCG demand, major sports-card sales and positive movement across a majority of tracked segments.
For collectors, the practical response is straightforward: enjoy the energy, document condition carefully, verify sale information before using it as a comp and buy within a budget that makes sense independent of next month’s chart. October’s $1.07 billion figure is a remarkable measure of the hobby’s current scale. It is not a substitute for patience, card knowledge or careful due diligence.