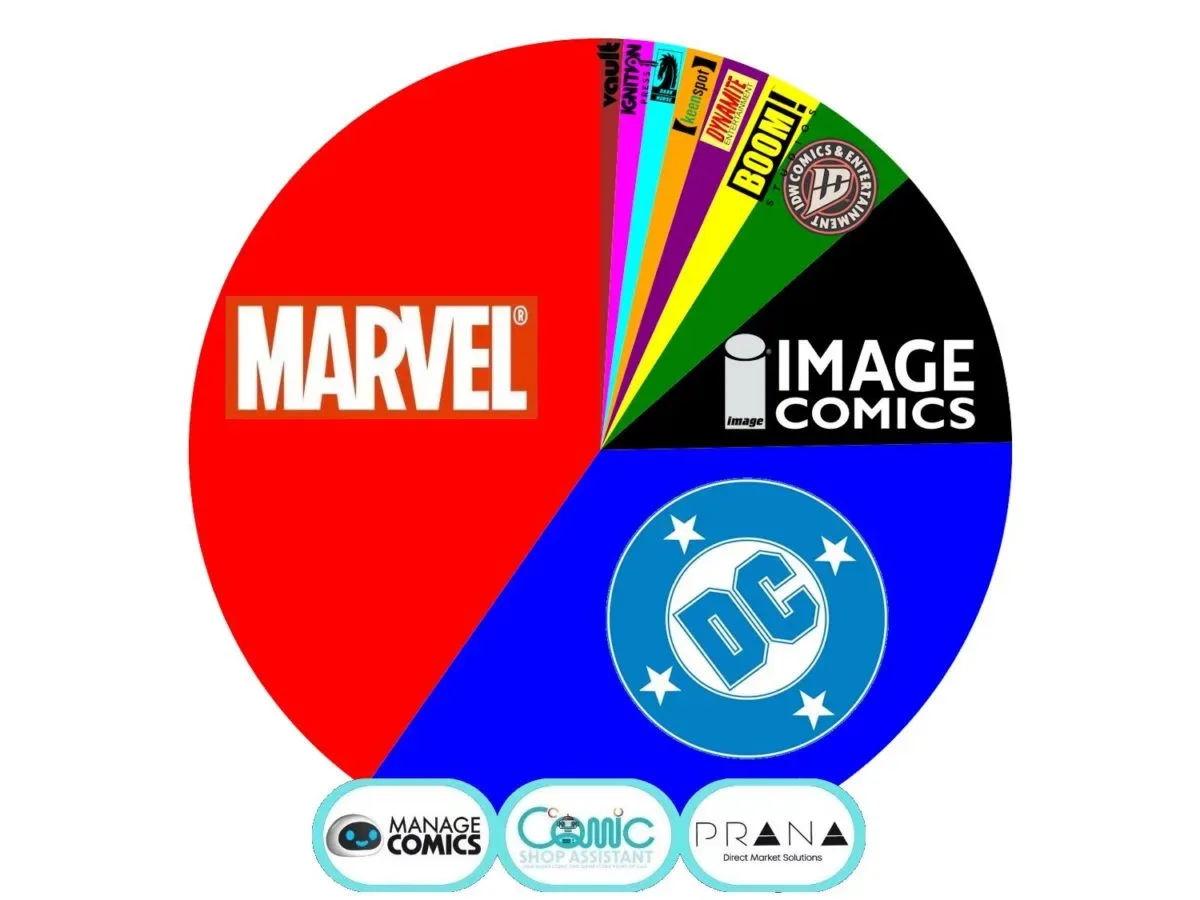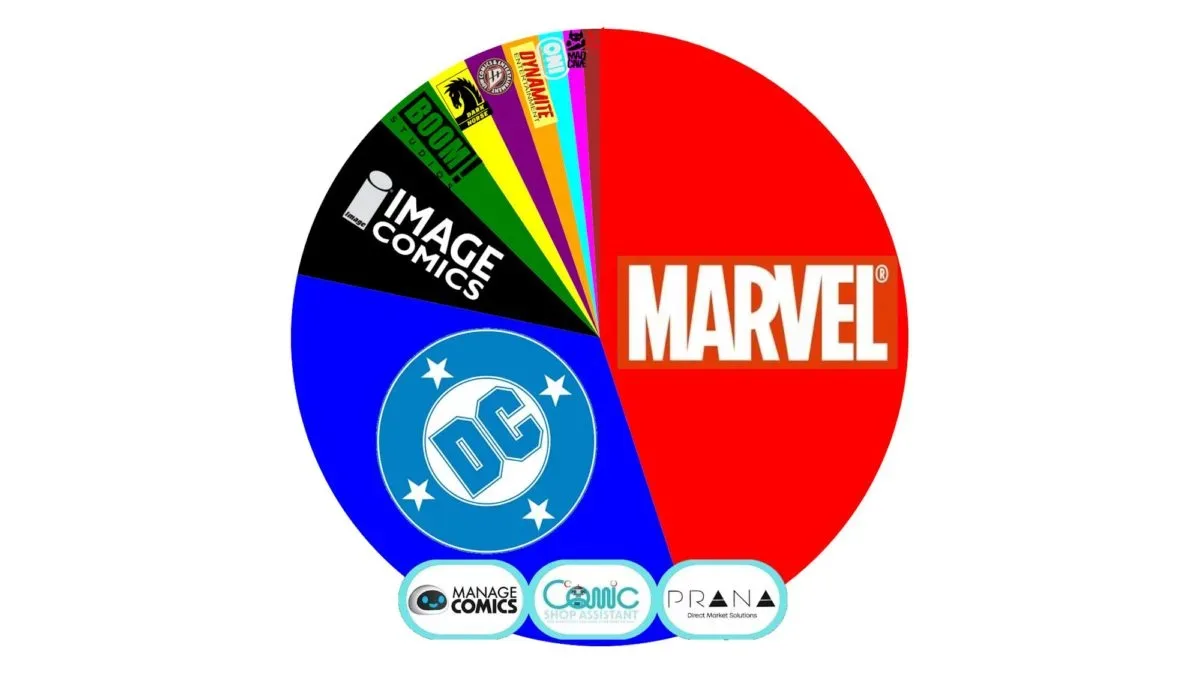

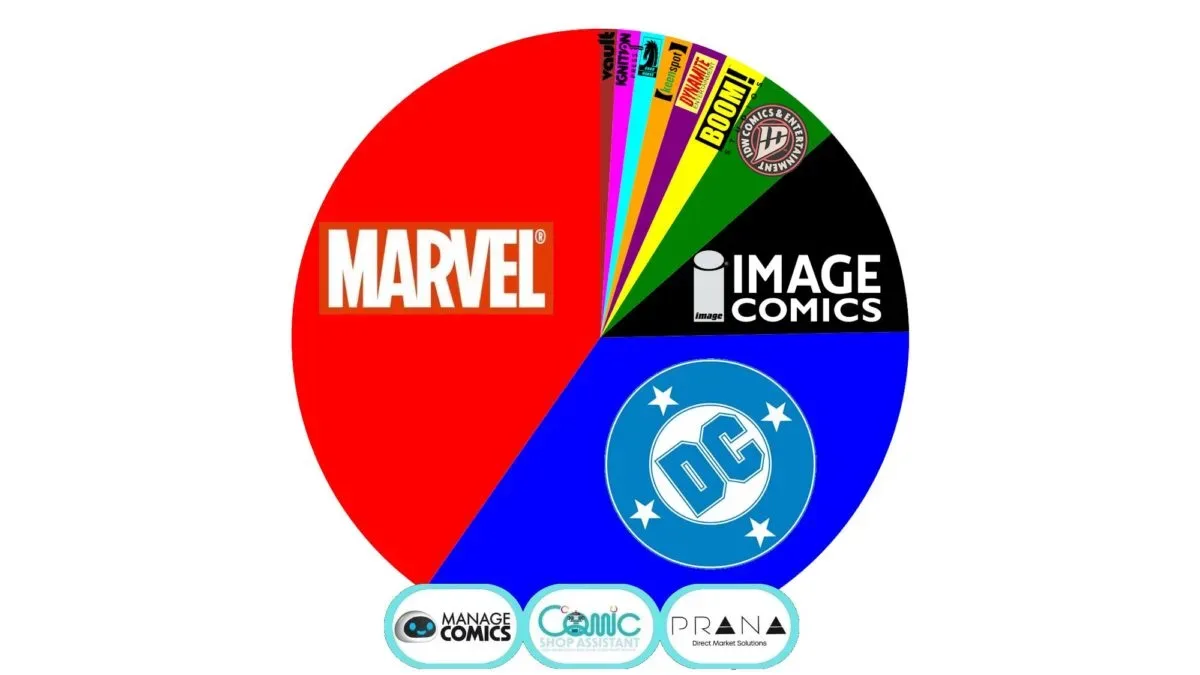
Marvel Comics held the largest share of the sampled comic-shop direct market for the week of October 13 through 19, 2026, taking 40.31% against DC Comics’ 35.00%. The gap is 5.31 percentage points, and the biggest story behind that lead is not solely a fresh release-week surge: Midnight Spider-Man #1 and Midnight X-Men #1 remained in the top two chart positions in their second week of sales.
That continuing performance matters in a weekly report. First issues often receive an immediate lift from advance orders, new-reader interest, variant-cover buying, and retailer expectations. Staying at the head of the chart after the initial week is a different signal. It suggests that the Midnight books continued generating enough sell-through within the participating stores to remain major contributors while other releases entered the market.
The weekly publisher-share results
The reported shares for the October 13-19 sales week are:
- Marvel Comics — 40.31%
- DC Comics — 35.00%
- Image — 11.22%
- IDW — 4.51%
- BOOM! Entertainment — 2.23%
- Dynamite — 1.90%
- Keenspot — 1.46%
- Dark Horse — 1.27%
- Ignition Press — 1.20%
- Vault Comics — 0.91%
Marvel and DC together account for 75.31% of the reported sales share. Image is the clear third-place publisher at 11.22%, while every other listed publisher comes in below 5%. That concentration is useful context for reading the headline: a weekly movement at the top can be shaped heavily by a relatively small number of high-volume superhero issues, especially launches and landmark-numbered books.
Marvel’s week was not dependent on Midnight alone. The publisher also placed Amazing Spider-Man #1001, Venom #1, Doom All-On-One #1, and DNX #3 among the weekly top-ten performers. Taken together, that is a broad set of contributors: a major Spider-Man issue, two number-one launches, an ongoing third issue, and two Midnight debuts carrying into their second sales week.
Why second-week placement is worth watching
Weekly point-of-sale reporting measures sales recorded during a defined Monday-to-Sunday window. It is not the same thing as a publisher’s full historical circulation, a complete national retail census, or a final lifetime total for an issue. It does, however, offer a look at what participating comic shops were actually selling during that week rather than simply what they ordered in advance.
That distinction is especially important for the Midnight titles. A chart-topping #1 can be driven by enthusiasm before release, but a second-week appearance at No. 1 or No. 2 means the books still stood out after their opening period. The available figures do not give unit sales, nor do they provide the title-by-title quantities needed to calculate the degree of any week-over-week decline. Readers should not infer that the issues sold the same amount in both weeks. The defensible takeaway is narrower: both remained the two leading comics in the reported weekly chart.
For retailers, the result can be a practical indicator of where demand remains active. A strong second week may inform replenishment decisions, shelf placement, and conversations with readers who missed the launch window. It can also be a reminder that an issue’s commercial story does not end on new-comic day. The data here cannot say whether purchases came from regular subscribers, walk-in readers, collectors seeking specific covers, or some mix of all three, so it should not be treated as a detailed buyer-behavior study.
Marvel’s top-ten depth explains the edge
The 40.31% result is best understood as a slate outcome rather than a single-book outcome. The Midnight books gave Marvel the first and second positions for a second consecutive week, while the publisher’s current Spider-Man line, the debuting Venom and Doom All-On-One books, and DNX #3 added more top-ten representation. A publisher can gain a weekly share lead either through one enormous title or a deep group of strong sellers. The information available points to the latter as a significant part of Marvel’s performance here.
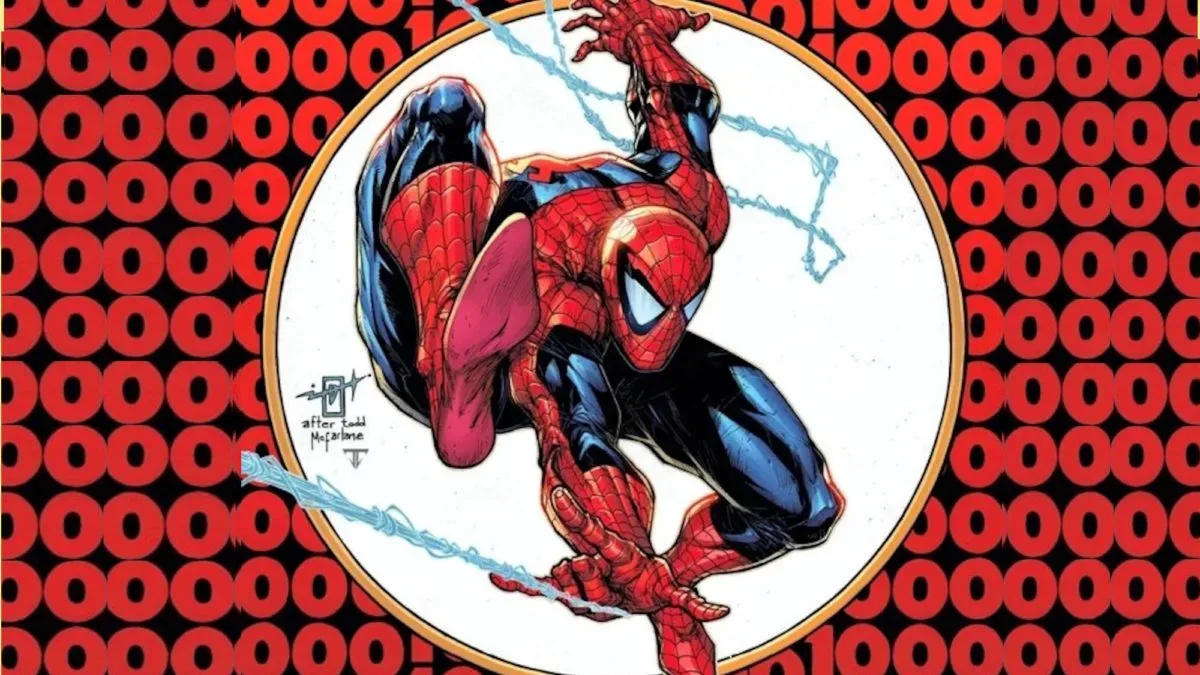
Amazing Spider-Man #1001 also illustrates why issue numbering still has commercial significance. A four-digit milestone communicates continuity and scale to established readers, while a #1 is a conventional entry point that can attract readers who do not want to begin in the middle of a long run. In the same week, Marvel had both kinds of attention-getter represented: a large-numbered Spider-Man installment and multiple fresh starts.
That does not establish why each individual issue sold, and it does not prove that any one format is more effective than another. The report has no sales totals by title, no cover-level breakdown, and no demographic information. Still, the combination helps explain why Marvel was able to build a 5.31-point lead over DC in this particular sample and period.
What “market share” means in this report
Market share is a publisher’s portion of the sales represented by the data set during the stated time frame. Here, the figures are based on point-of-sale data from more than 600 comic shops using the Manage Comics and Comic Shop Assistant systems. The reporting window runs Monday through Sunday.
The participating shops represent a substantial but incomplete part of the direct market. The data set is described as covering more than 600 stores, while an estimated 1,800 to 2,000 shops currently order through the direct market. That means these percentages should be read as a snapshot of the participating-store sample, not a universal measure of every comic shop, every digital storefront, bookstore sales, library circulation, or international demand.
“Direct market” is also a useful term to separate from the wider comic-book business. In this context, it concerns comic specialty stores ordering through the direct-market channel. The numbers do not attempt to describe all formats or all ways readers obtain comics. That limitation does not make the report unhelpful; it defines what question the report can answer. It is a weekly view of activity in a particular retail channel and sample.
How to read the rest of the ranking
DC’s 35.00% keeps it firmly in contention, rather than indicating a distant second place. The difference between the two largest publishers is meaningful for a single week, but the two remain far ahead of the rest of the reported field. Image’s 11.22% gives it more than double IDW’s 4.51%, reinforcing its position as the leading publisher outside Marvel and DC in this week’s sample.
Below that, the individual shares are comparatively compact: BOOM! Entertainment at 2.23%, Dynamite at 1.90%, Keenspot at 1.46%, Dark Horse at 1.27%, Ignition Press at 1.20%, and Vault at 0.91%. These numbers should not be mistaken for a creative ranking or a measure of a publisher’s cultural importance. They quantify a slice of one week’s specialty-shop sales. A publisher can have fewer releases in a particular period, a different publishing cadence, or business in channels outside the scope of these figures.
The report also references top-ten ratio comparisons for the current and preceding sales weeks, but the underlying ratios are not included in the supplied figures. As a result, no precise comparison of those ratios can be made here. Likewise, although the earlier October 6-12 heading is present, its publisher-share table is not provided. Claims about numerical week-over-week market-share movement beyond the October 13-19 results would therefore go beyond the available evidence.
What readers and retailers can take from the chart
- Midnight has staying power in the sample: Midnight Spider-Man #1 and Midnight X-Men #1 held the first two chart positions for a second week.
- Marvel’s lead came from multiple books: the publisher had additional top-ten support from Amazing Spider-Man #1001, Venom #1, Doom All-On-One #1, and DNX #3.
- Weekly share is a retail snapshot: it reflects reported point-of-sale activity in participating direct-market shops, not an all-channel or final-sales verdict.
- The top two remain dominant: Marvel and DC combined for more than three quarters of the reported market share.
The result lands in a wider pop-culture space where comic characters often move across media, a relationship also visible in discussion around the deliberately exaggerated tone of the Street Fighter movie. But this particular chart is about specialty-comic-shop sales, and its clearest message is straightforward: in the sampled October 13-19 week, Marvel had the top share, led by a two-week Midnight hold and a notably crowded top-ten lineup.