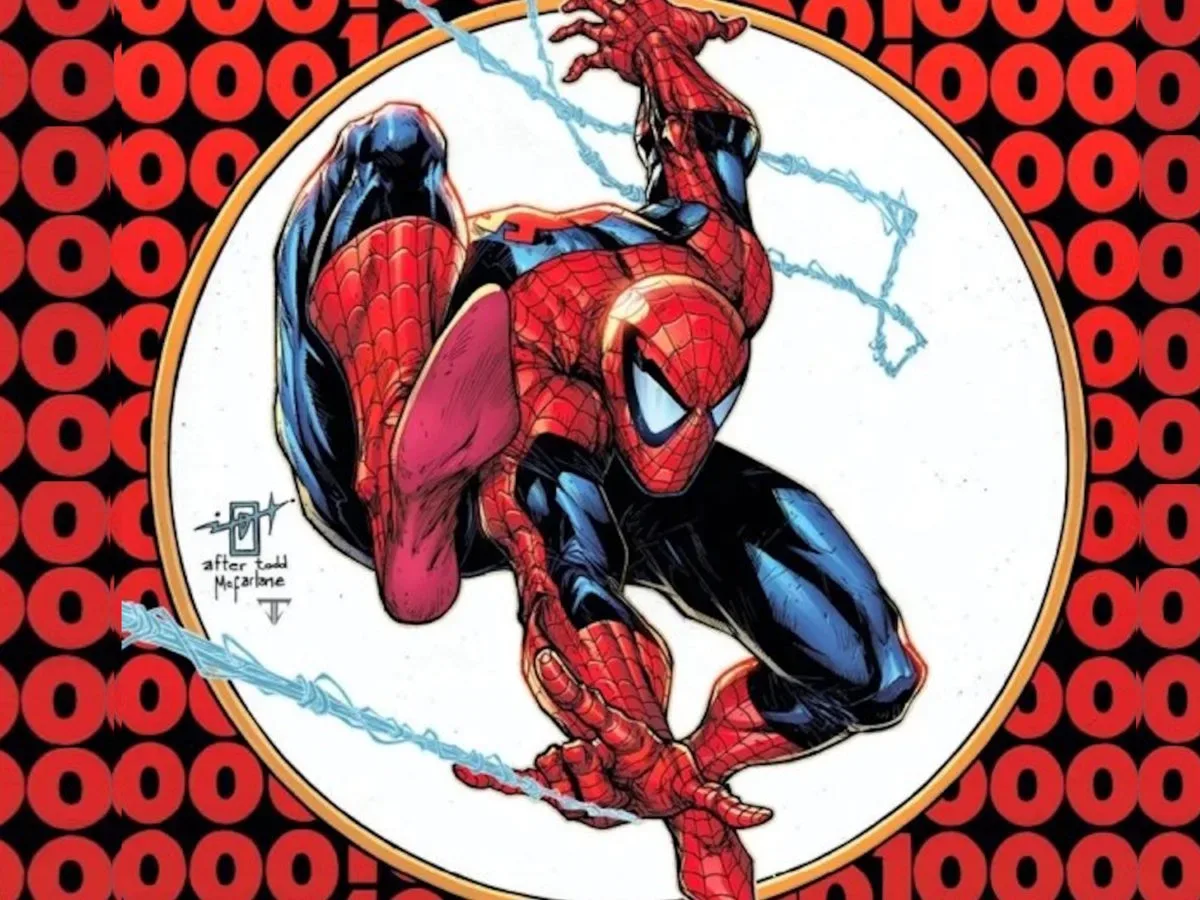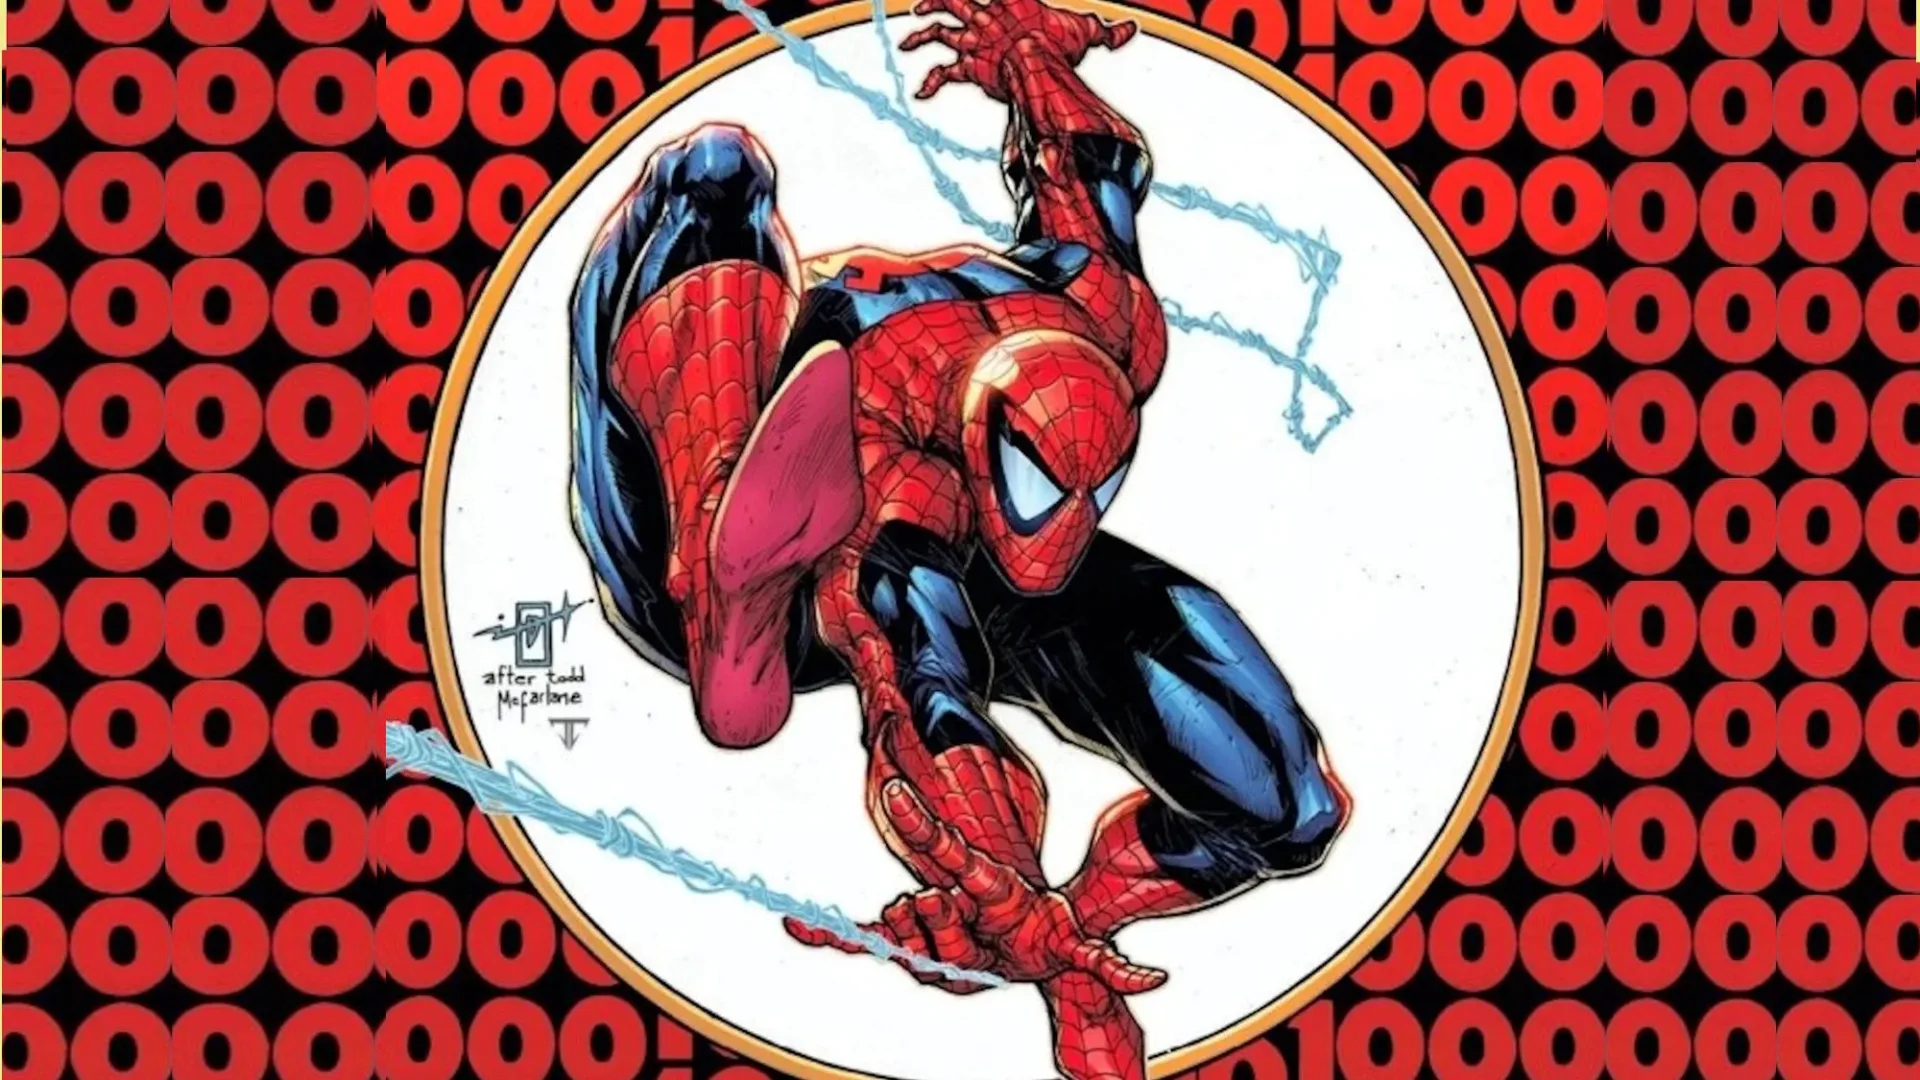

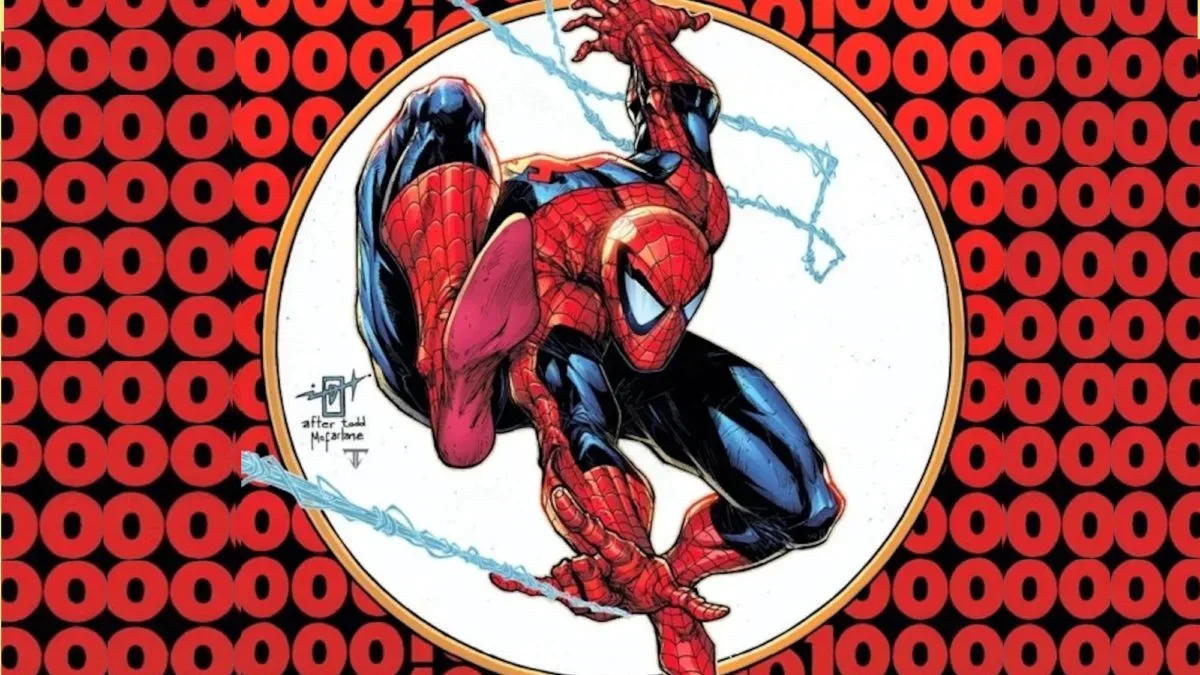
Amazing Spider-Man #1000 was the clear runaway leader in a weekly snapshot of direct-market comic shop sales, reportedly moving about five times as many copies as the closest titles in the field. The issue’s lead was not a narrow win or a photo finish: it created a substantial gap between Spider-Man’s milestone release and a chasing group led by Amazing Venom #1, Alien vs. X-Men #1, and DNX #2.
The result also gave Marvel an especially strong week across the wider chart. Eight of the 11 reported bestsellers came from Marvel, including the top four positions. DC supplied the other three entries: Poison Ivy, Zatanna, and the prior week’s Absolute Batman.
For comic readers, retailers, and collectors following what is actually leaving shop shelves, the most important detail is the type of measurement involved. These rankings are based on in-store point-of-sale sales, rather than publisher orders. In other words, they record reported purchases by customers at participating stores—not the number of copies stores initially ordered from distributors.
What the Spider-Man #1000 result says—and what it does not
A five-to-one advantage over the nearest competition is a striking weekly result. It suggests that the issue was an unusually prominent draw in the participating stores during the measured period. The #1000 designation plainly gave the book a powerful, instantly recognizable identity: even without making claims about its story or contents, a round-number landmark issue is easy for both regular readers and occasional buyers to spot on a new-release shelf.
That said, the chart should not be read as a complete census of every comic sold everywhere. The data pool covers roughly 120 to 150 comic shops, drawn from a much larger direct-market population estimated at about 1,800 to 2,000 stores. Participating shops are described as generally mid-sized, with locations largely in North America and the UK.
That still makes the list useful. A sample spanning more than one hundred stores can reveal meaningful patterns in what people bought over a specific period. But it is best understood as a reported retail-sales snapshot, not a definitive statement of total sales across every physical and digital channel.
Why actual sell-through matters
Comic-book sales discussions can become confusing because different figures answer different questions. Publisher orders show what retailers chose to bring into their stores in advance. Those orders can reflect confidence, promotional planning, variant-cover programs, subscription pull lists, and retailers’ expectations about walk-in demand.
Point-of-sale data, meanwhile, tracks copies scanned or otherwise recorded as sold to customers. It is closer to the question readers often mean when they ask, “What did people buy this week?” It does not erase the importance of retailer orders—shops must order stock before anyone can buy it—but it measures a different stage in the comic’s retail journey.
That distinction is particularly relevant for a major issue such as Amazing Spider-Man #1000. A large initial order would demonstrate retailer confidence, while a large reported sales lead demonstrates that the book also performed strongly at checkout in this group of stores. The available data supports the latter conclusion for this reporting window.
Timing makes the lead more notable
The issue had already been available beginning the prior weekend for Local Comic Shop Day, yet it still topped the Wednesday-to-weekend chart by an overwhelming margin. This matters because an earlier release opportunity could potentially distribute some demand before the regular Wednesday sales window.
Instead, the book remained the week’s standout seller in the reported data. The result cannot tell us precisely how many readers bought their copies before Wednesday, how many versions were involved, or what share of the issue’s total retail demand occurred during each window. It does show that demand was still extremely visible in the subsequent sales period.
For shops, that kind of performance can make a title the centerpiece of a release week. A major Spider-Man issue may be the comic that pulls a customer through the door, while new first issues and related superhero titles benefit from the same trip. The chart alone cannot prove that spillover occurred, but the clustering of Marvel books near the top is consistent with a week in which Marvel releases held a particularly strong share of attention.
Marvel’s top-four sweep and the X-Men presence
Marvel’s eight placements in the Top 11 represent a broad showing beyond the Spider-Man result. The immediate chasing pack included Amazing Venom #1, Alien vs. X-Men #1, and DNX #2, and the overall Marvel total was aided by several X-Men titles.
The top-four sweep is notable because it pairs a landmark-number issue with books carrying fresh-entry momentum. A #1 issue can provide a low-friction invitation for readers who do not want to begin in the middle of a long run. A #1000 issue serves a different function: it signals scale, history, and event-level importance. Both are highly visible ways of asking a shopper to pick up a comic, even if they appeal to different buying instincts.
It is important not to overstate the relationship between the titles. The figures provided establish their relative performance in the chart, but they do not provide raw unit totals, demographic information, reasons for purchase, or evidence that one comic’s audience directly overlapped with another’s. What is clear is that Marvel’s line had a very successful retail week among the participating stores.
DC’s three-chart footholds
DC’s share of the list came through Poison Ivy, Zatanna, and Absolute Batman, the latter having appeared on the prior week’s chart as well. That gives DC representation across three distinct character-led books while Marvel controlled most of the rankings.
Absolute Batman retaining a place after its earlier chart appearance is a useful reminder that these lists do not solely reward brand-new releases. A book can continue to sell after its first week, whether through sustained reader demand, customers catching up, or stores continuing to move stock. The available information does not break down which factor applied here, but the repeat appearance is still a meaningful data point.
Readers interested in Gotham-related comic coverage can also see how another Batman story is positioning Poison Ivy as a looming threat in Batman #14’s Mr. Freeze and Poison Ivy setup.
How to read a percentage-based bestseller chart
This style of ranking expresses every title relative to the top-selling reported book, which is assigned a score of 100.0. If another issue is shown at a lower figure, it indicates how it performed as a percentage of the leader’s sales in the submitted data.
The method is helpful because it conveys distance between books without publishing raw copy counts. In this case, the central takeaway is not merely that Amazing Spider-Man #1000 finished first. It is that its advantage was massive: the leading issue reportedly sold around five times the amount of its nearest rivals.
There are limits, too. Percentages do not reveal total market volume. A 100.0 score identifies the leader within the sample, but it does not by itself say how many individual comics were sold, how many were sold outside the reporting group, or whether the same score in another week represented the same number of copies. Comparing the chart internally is sound; treating it as a universal sales ledger is not.
Practical takeaways for readers and collectors
- For readers: The chart identifies books with strong recent shop demand, not a quality ranking. A high placement can be a useful discovery prompt, but it is not a substitute for choosing the characters and creative directions that interest you.
- For collectors: Strong demand during one retail window does not establish rarity, long-term value, or future availability. Those questions require information not supplied by this chart, including print quantities, later printings, condition, and sustained interest.
- For retailers: The result highlights how a clearly signaled milestone issue can dominate a short sales period, even after an earlier Local Comic Shop Day availability window.
- For chart-watchers: Treat the data as a useful view of consumer sell-through at participating direct-market stores, with the coverage limits of any sample-based report.
The week belonged decisively to Amazing Spider-Man #1000. Marvel’s wider eight-of-11 showing underscored the scale of that performance, while DC’s Poison Ivy, Zatanna, and Absolute Batman prevented the list from becoming a complete one-publisher sweep. The more enduring lesson is methodological as much as competitive: these figures track comics that shoppers actually bought at participating stores, offering a focused window into retail demand rather than simply the stock that arrived behind the counter.