
Marvel Comics held 45.00% of measured comic-shop sales during the October 6-12 tracking week, a striking result given that the publisher’s performance was attributed to just three books: Midnight Spider-Man, Midnight X-Men and Midnight Fantastic Four.
The figure comes from point-of-sale records gathered across more than 600 stores using the Manage Comics and Comic Shop Assistant systems. It is a strong weekly showing, putting Marvel well ahead of DC Comics at 33.29% and leaving the remaining publishers to divide a much smaller portion of the reported market.
That last distinction matters. This is a snapshot of sales at participating direct-market comic shops over one Monday-to-Sunday period, not a count of every comic book sold everywhere. Still, it offers a useful look at what moved through a substantial cross-section of specialty retailers—and this particular week belonged decisively to Marvel’s Midnight line.
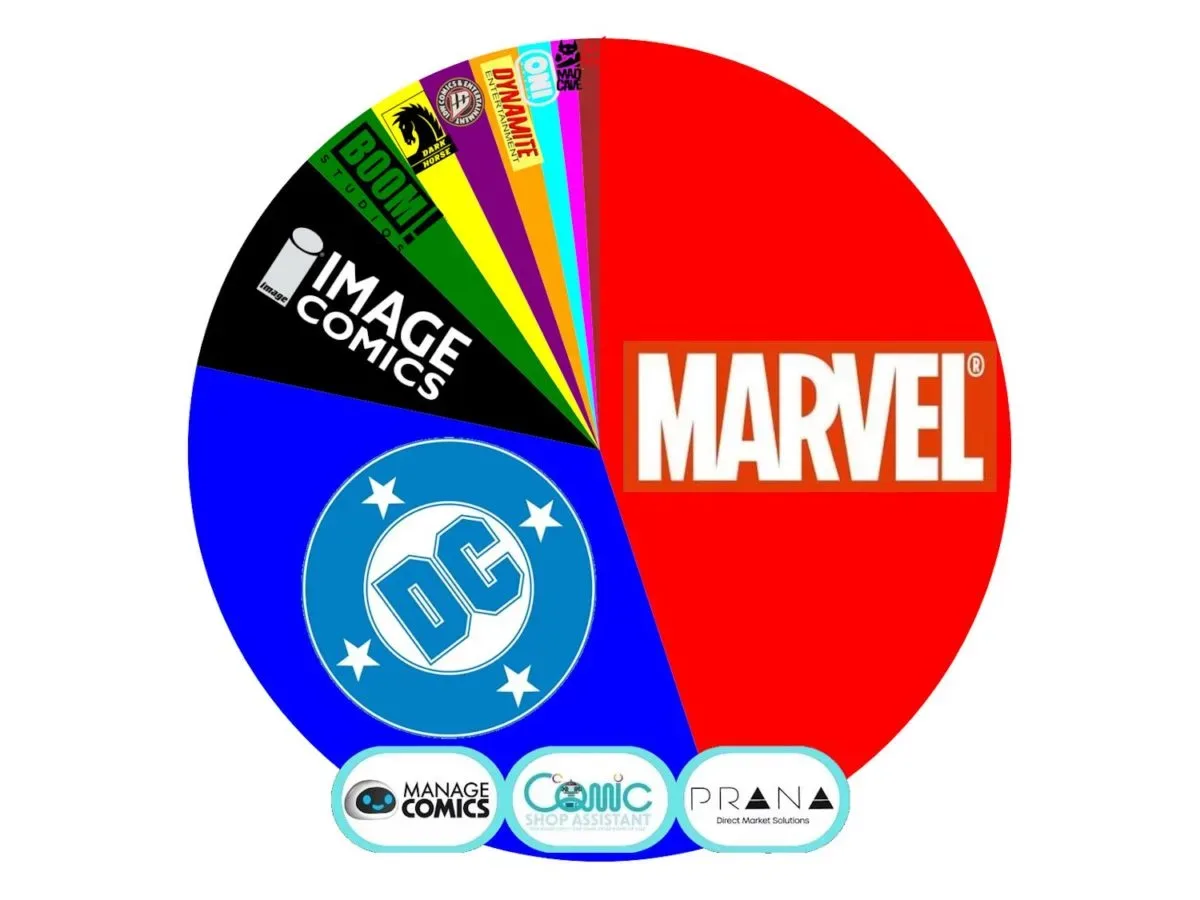
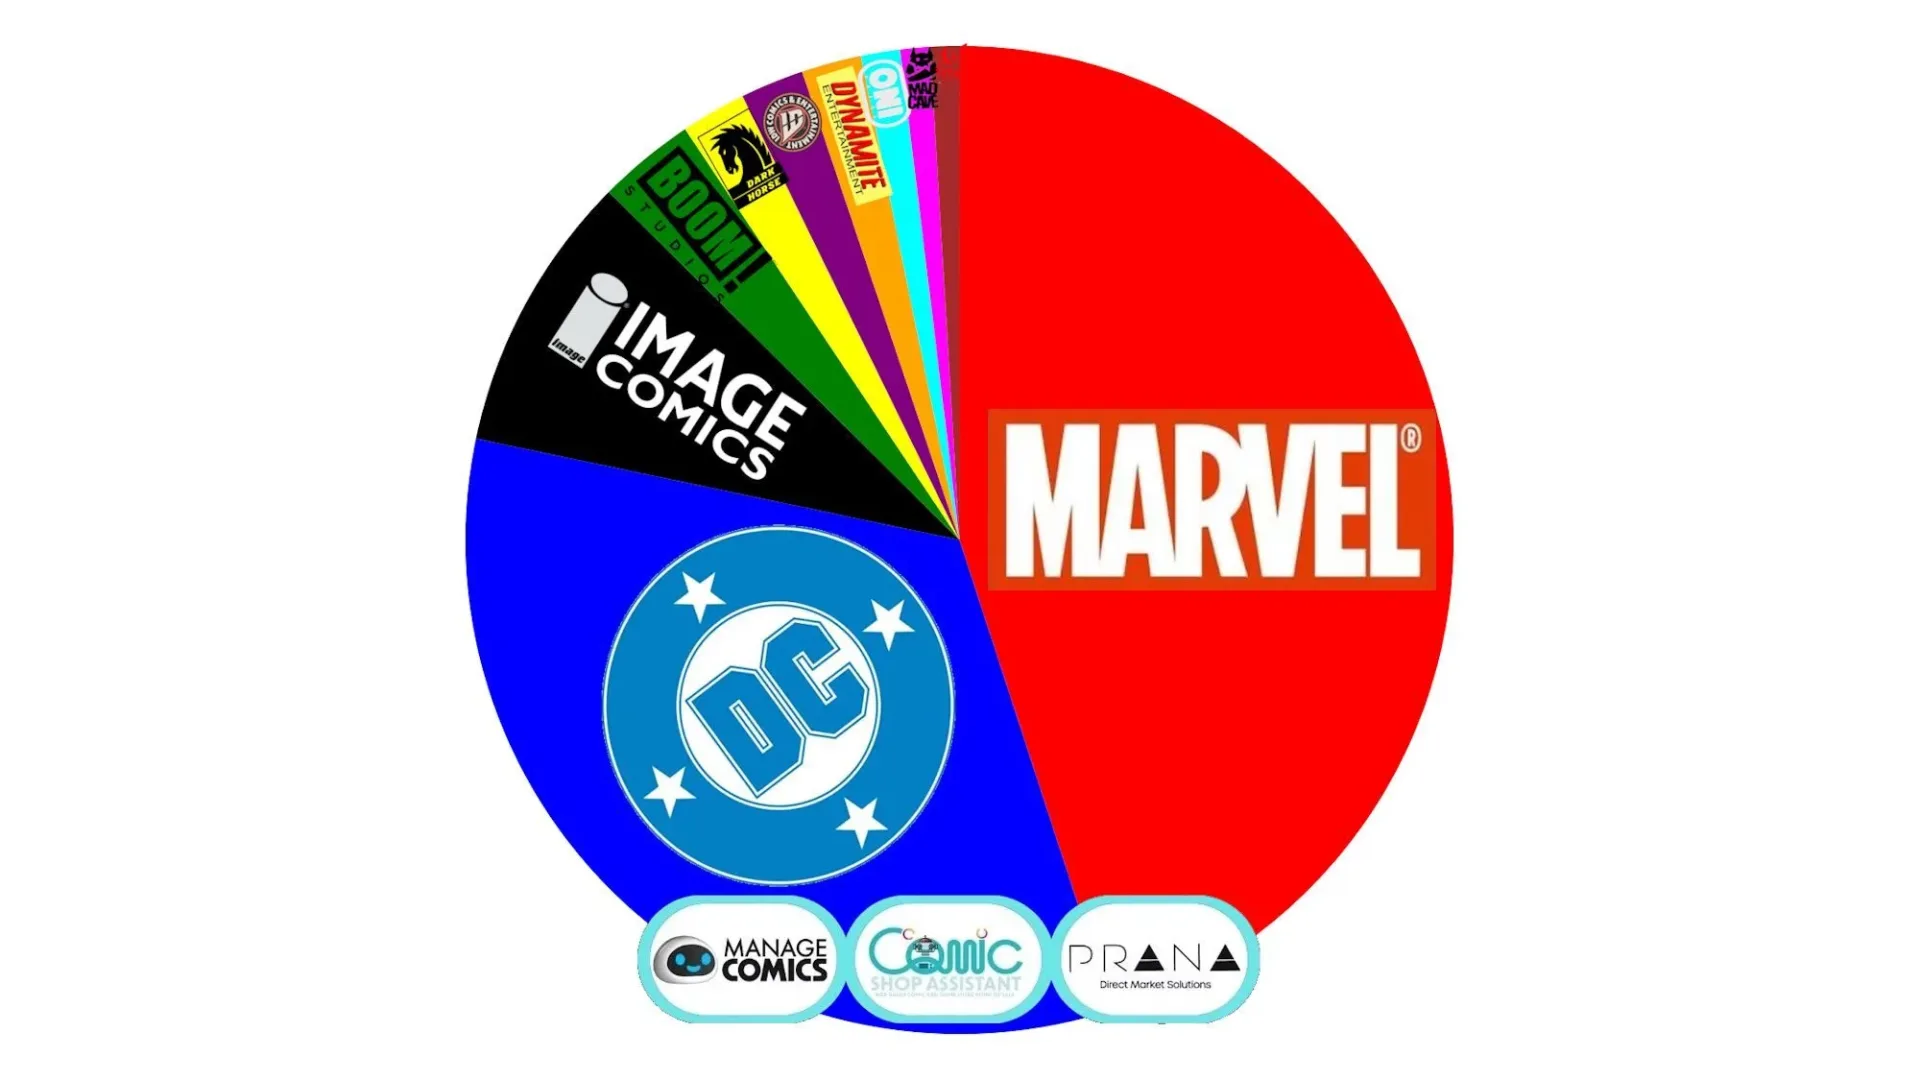
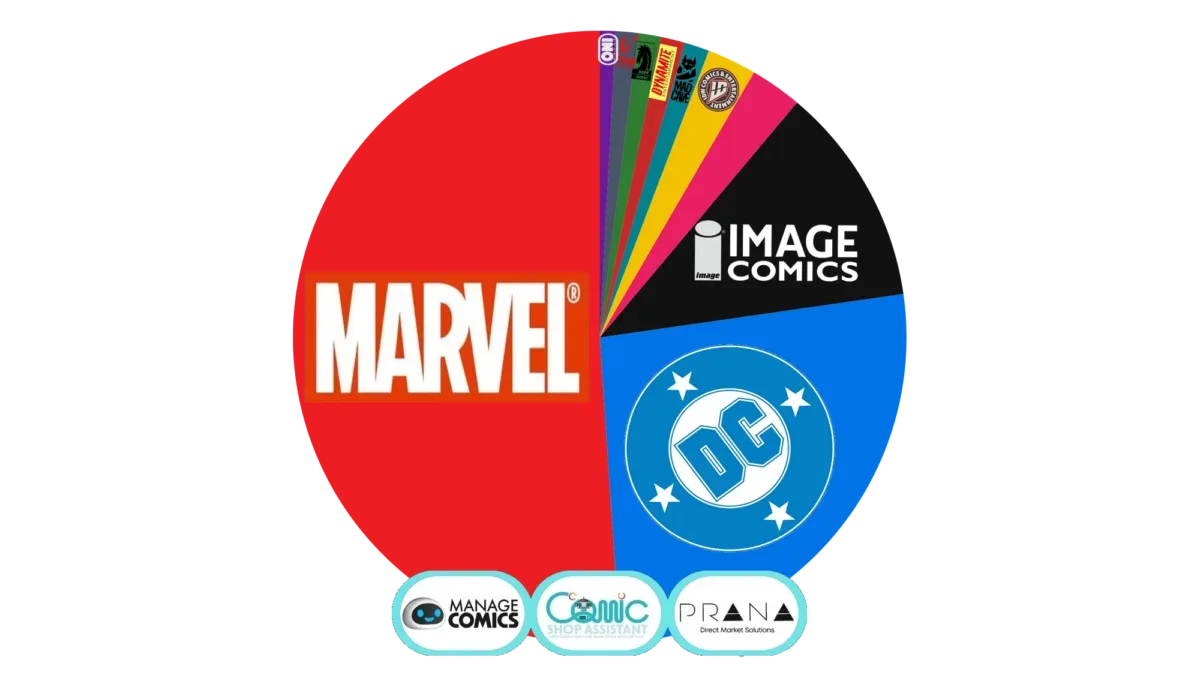
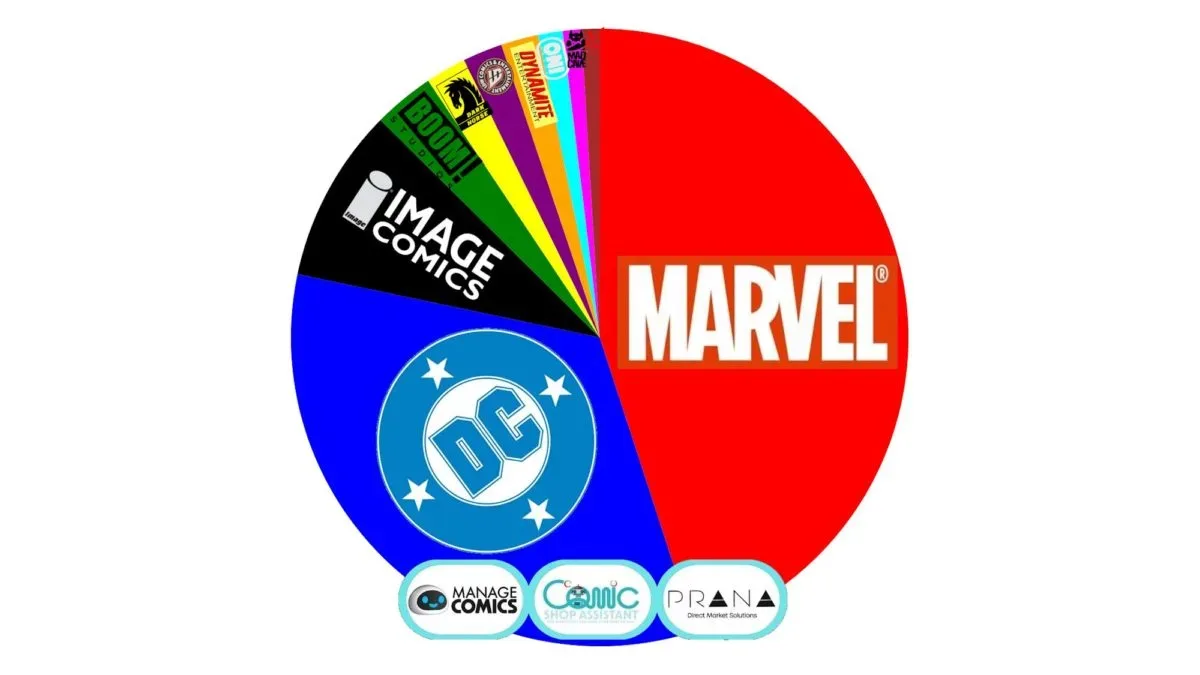
Comic-shop market share for October 6-12
- Marvel Comics: 45.00%
- DC Comics: 33.29%
- Image Comics: 9.15%
- Boom Studios: 3.19%
- Dark Horse Comics: 2.13%
- IDW Publishing: 2.08%
- Dynamite Entertainment: 1.96%
- Oni Press: 1.28%
- Mad Cave Studios: 0.97%
- Titan Comics: 0.95%
Marvel’s lead over DC was 11.71 percentage points. Its share was also just under half of all sales represented by the dataset, an unusually concentrated weekly outcome when the cited driver is a trio of releases rather than a wide slate spread across multiple franchises and formats.
Why three titles can shift a weekly chart
Market share measures the portion of the tracked sales total captured by each publisher. In practical terms, every publisher is competing for slices of the same weekly pie. A handful of especially active releases can therefore move the percentages sharply, particularly during a short seven-day reporting window.
Marvel’s Midnight books appear to have done precisely that. Midnight Spider-Man, Midnight X-Men and Midnight Fantastic Four bring three of the publisher’s most recognizable superhero brands into the same named release grouping. The available sales data does not establish why individual customers bought them, nor does it provide issue-by-issue unit totals. What it does show is the combined result: the three books were enough to push Marvel to 45.00% of participating shops’ recorded sales for the week.
That is useful context for readers tempted to treat a weekly market-share table as a permanent ranking. It is better understood as a release-calendar result. A publisher’s placement reflects which products reached shelves, how strongly those products sold at the participating stores, and what competing publishers had on sale during the same interval. One major launch cluster can produce a very large swing without proving that every other publisher or title suddenly lost its audience.
The inverse is also true. A quieter release week can make a publisher’s share appear lower even if its existing series remain healthy. Weekly sales data is valuable because it catches momentum as it happens, but the narrow timeframe means it should not be used alone to declare a long-term winner.
DC still accounts for roughly one-third of the measured market
DC’s 33.29% share kept it firmly in second place and demonstrated that Marvel’s big week did not erase the competitive weight of DC’s line. The books cited among DC’s contributors were Batman #14, Absolute Superman #24, Demon #1, Jonah Hex And The Shadow Of Death #1 and Absolute Green Lantern #19.
That mix includes familiar flagship characters alongside new first issues. A #1 is a debut issue, generally significant in comic-shop sales because it provides a clear starting point for readers and can be a focal point for retailer ordering. Established numbered series, meanwhile, serve readers already following a continuing story. The data here does not break out the contribution of each DC book, but it does indicate that this range of releases supported a one-third share in a week dominated by Marvel’s three-title push.
There is also an important forward-looking caveat in the market discussion around this week: Absolute Batman #25 was described as showing strong sales so far and as a possible force later in the month. That is not the same as a result in the October 6-12 numbers. It is an indication that later weekly reports may look different once that book’s sales are represented. For now, the confirmed result is Marvel at 45.00% and DC at 33.29% in the stated period.
For more DC-related comic-book coverage, see the latest report on DCU discussion around Man of Tomorrow.
Image and the rest of the field
Image Comics ranked third with 9.15%. That is a considerable distance behind the top two publishers, but it also put Image comfortably ahead of the rest of the non-Marvel, non-DC field in the reported data. Marvel and DC together accounted for 78.29% of the measured sales total, leaving 21.71% for all other listed publishers combined.
Boom Studios took 3.19%, aided by Something Is Killing The Children #50. Milestone issue numbers can be meaningful retail moments because they give shops and readers a conspicuous point in a series’ run. The available figures do not identify precisely how much of Boom’s share came from that issue, so it would be inappropriate to assign it a specific sales contribution. The evidence supports the narrower point: the release helped lift Boom during the week.
Dark Horse followed at 2.13%, narrowly ahead of IDW at 2.08%. Dynamite reached 1.96%, while Oni Press reported 1.28%. Mad Cave Studios and Titan Comics completed the listed table at 0.97% and 0.95%, respectively. The small gaps in this part of the chart are worth noting. Dark Horse and IDW were separated by only 0.05 percentage points, and Mad Cave and Titan by 0.02 points. In a weekly sample, a modest shift in sales can change the ordering of publishers clustered that closely.
What point-of-sale data does—and does not—tell us
Point-of-sale data, often shortened to POS data, is information recorded when a store makes a sale. That is different from a list of orders placed by retailers before a comic arrives, and it is different again from a publisher’s total distribution or revenue report. In this case, the data captures the sales activity of participating comic shops during a defined week.
The reporting pool includes more than 600 stores. The broader direct market is estimated at roughly 1,800 to 2,000 shops, so the dataset covers a significant portion but not the entire specialty-store landscape. That breadth gives the results real value as an indicator, while the partial coverage sets a clear limit: these percentages should be read as the measured sample’s market shares, not an exhaustive census of every direct-market sale.
The scope is also specifically the direct market, meaning the comic-shop channel represented by these specialty retailers. The supplied information does not provide equivalent sales results from other retail channels, digital storefronts, subscriptions, libraries, conventions or international markets. None of those should be assumed to be included in the 45.00% figure.
Another limitation is that percentages reveal relative performance, not the size of the underlying sales total. A 45% share says Marvel captured 45 cents of every tracked sales dollar—or an equivalent proportion of the measurement used—in the sample during that week; the reported table does not provide the total number of comics sold, total spending, or individual title totals. It can establish a commanding lead, but it cannot tell readers how many copies a particular Midnight issue sold.
What the week means for comic-shop readers
For readers, the clearest takeaway is that a coordinated group of recognizable Marvel releases can still concentrate demand in specialty stores. Spider-Man, X-Men and Fantastic Four are separate properties, but the Midnight branding tied them together in the marketplace for this week. The sales table suggests that the combination gave retailers a major Marvel-centered period on the calendar.
For anyone following publisher performance, the more measured takeaway is to watch several weeks rather than just one. Marvel’s result is emphatic, and DC’s one-third share is substantial. Image’s third-place position and Boom’s boost around Something Is Killing The Children #50 show that the chart was not exclusively a two-publisher affair. Yet the week’s defining feature remains concentration: three Marvel titles were identified as the engines behind nearly half of the recorded comic-shop market.
The next shifts will depend on the titles entering the schedule and how buyers respond. The October 6-12 data gives no need to overcomplicate the immediate result: Marvel won the week by a wide margin, DC remained a formidable second, and the Midnight trio supplied the central sales story.