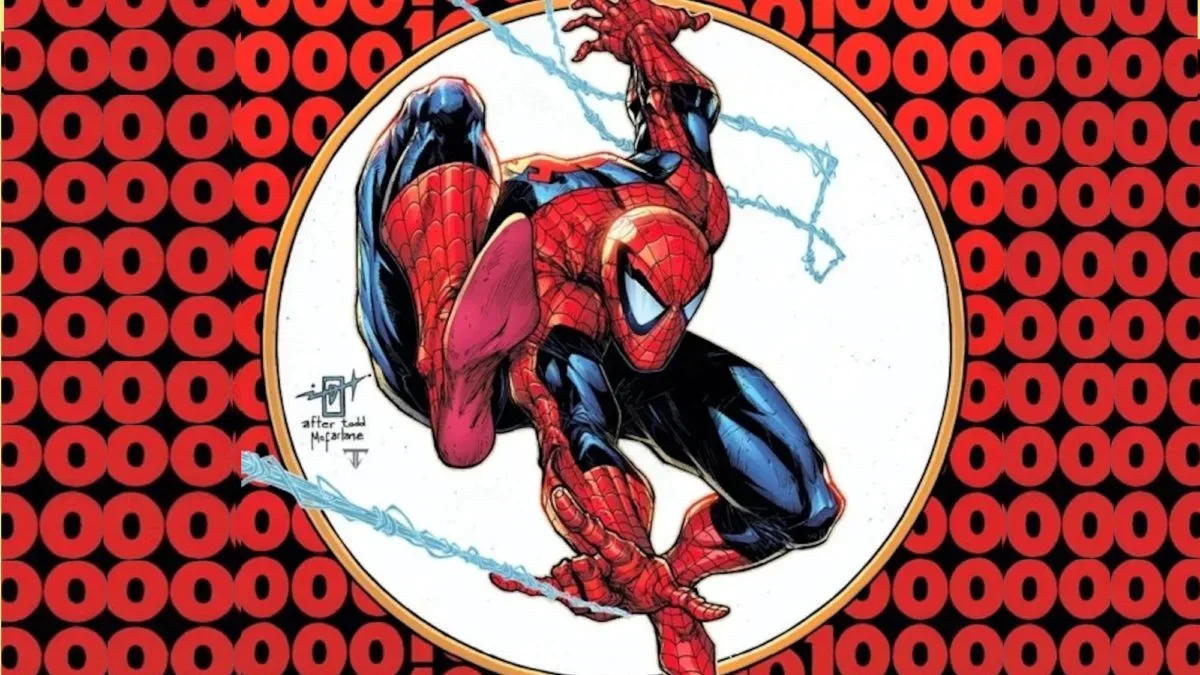

Marvel had a remarkably concentrated week in the comic-shop direct market, taking 51.07% of tracked publisher sales from September 29 through October 5. The defining release was Amazing Spider-Man #1000, which sold at a level far beyond every other individual comic in the reporting period.
That result matters on two levels. It put Marvel above half of the weekly publisher market measured in the data, and it illustrates how a landmark issue can reshape a short-term sales chart. A large group of other Marvel releases also populated the leading titles, including a new Amazing Venom series, Alien Vs X-Men, several X-Men books, Fantastic Four, and the ending of Queen In Black.
A Spider-Man landmark sets the week’s pace
Amazing Spider-Man #1000 served as the 100% baseline in the weekly title comparison. The next-closest listed books were all below one-fifth of that volume: The Amazing Venom #1 registered 18.75%, while DC’s Absolute Batman #24 was at 17.95% and Marvel’s DNX #2 at 17.71%.
Those figures are best read as a comparison against the week’s best-selling issue, not as each book’s percentage of the whole market. In plain terms, for every 100 copies of Amazing Spider-Man #1000 represented in this index, The Amazing Venom #1 represented roughly 19 and Absolute Batman #24 roughly 18. The enormous gap demonstrates that Spider-Man’s milestone was not simply the leader of a tight race; it was the outlier that defined the period.
Milestone numbering can be commercially powerful because it gives regular readers a clear event issue while also giving retailers an obvious book to spotlight. The tracked data does not identify why each individual sale occurred, so it cannot establish whether buyers were motivated by the number, the character, creative material, variants, or another factor. What it does establish is the scale of the book’s lead during this particular Monday-to-Sunday window.
Marvel’s depth went well beyond one issue
A single breakout comic can move a publisher’s weekly percentage substantially, but Marvel’s 51.07% share was also supported by broad representation near the top of the chart. Eight of the ten listed leading issues came from Marvel.
- The Amazing Venom #1 — 18.75% of the Amazing Spider-Man #1000 baseline
- DNX #2 — 17.71%
- Alien Vs X-Men #1 — 17.19%
- X-Men #38 — 14.27%
- Fantastic Four #17 — 14.37%
- Uncanny X-Men #36 — 13.35%
- Queen In Black #5 — 11.77%
There is a useful mix in that group. New number-one issues appear alongside continuing superhero series and a finale. That matters because their sales roles are different. A first issue is an entry point that may attract readers who do not normally follow an ongoing title. An established issue depends more on a continuing audience. A finale can appeal to readers who want to complete a storyline. Across one week, those different release types gave Marvel several paths into the upper end of the chart.
The concentration of X-Men-related material is also visible in the titles alone: Alien Vs X-Men #1, X-Men #38, and Uncanny X-Men #36 each appeared among the leaders. But the available figures do not separate crossover interest, individual series readership, or the effects of release timing. It is safer to say Marvel had multiple successful books involving the X-Men than to treat the data as a measurement of demand for any one character or storyline.
DC finishes second, led by Absolute Batman
DC took second place among publishers with 26.20% of tracked sales. Absolute Batman #24 was its top listed performer at 17.95% of the Spider-Man benchmark, just ahead of DNX #2 and Alien Vs X-Men #1 in the comparison figures. Poison Ivy #48 also reached the top ten at 13.35%.
That leaves DC with two of the ten listed leaders during a week in which Marvel’s milestone issue captured much of the market’s attention. The result should not be stretched into a verdict on either publisher’s long-term standing. Weekly charts are especially sensitive to the composition of a release slate: a major anniversary issue, a new series launch, a finale, or the absence of a regularly prominent title can materially alter the picture.
For readers following DC’s current Batman output, the upcoming Barbara Gordon-focused Absolute Batman #26 is another sign that the line remains a notable part of the publisher’s schedule, even though this reporting week belonged decisively to Spider-Man.
The rest of the publisher chart
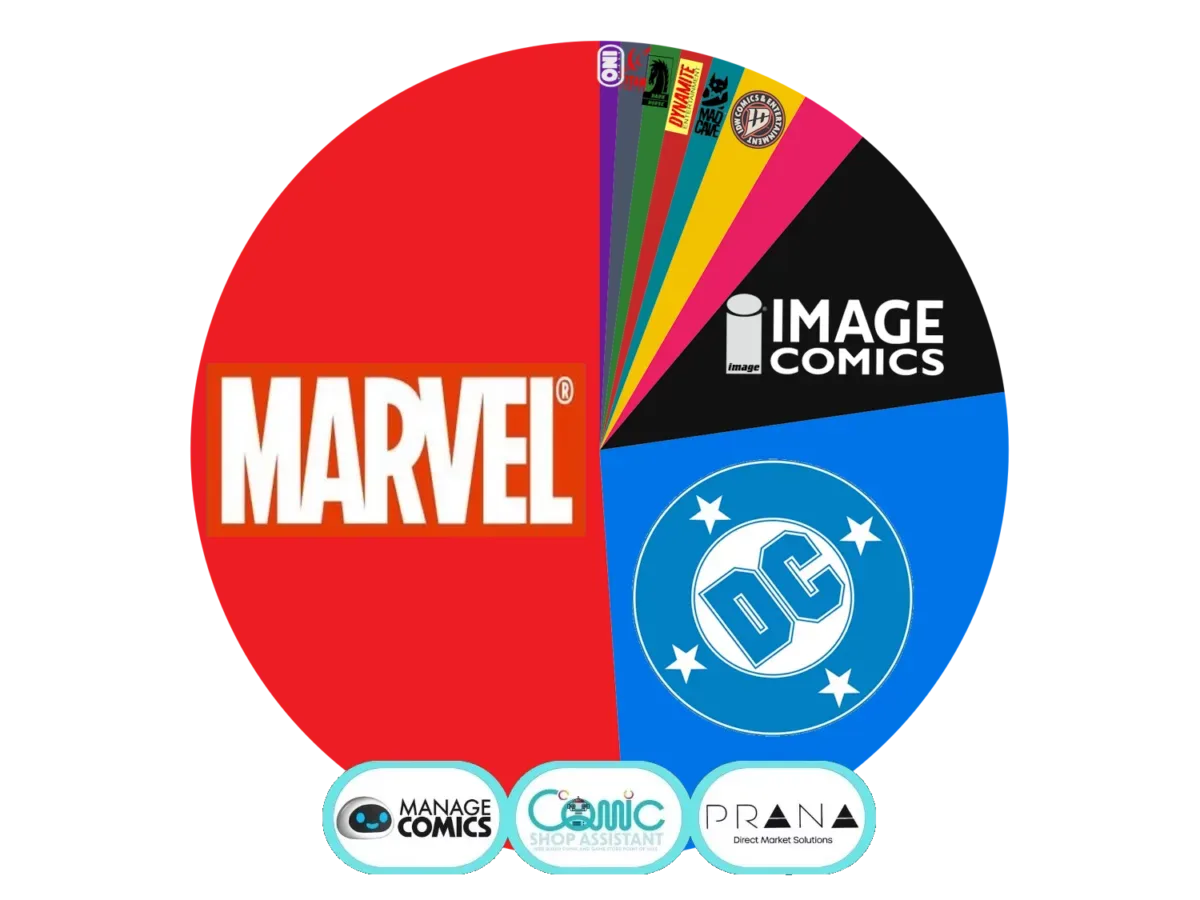
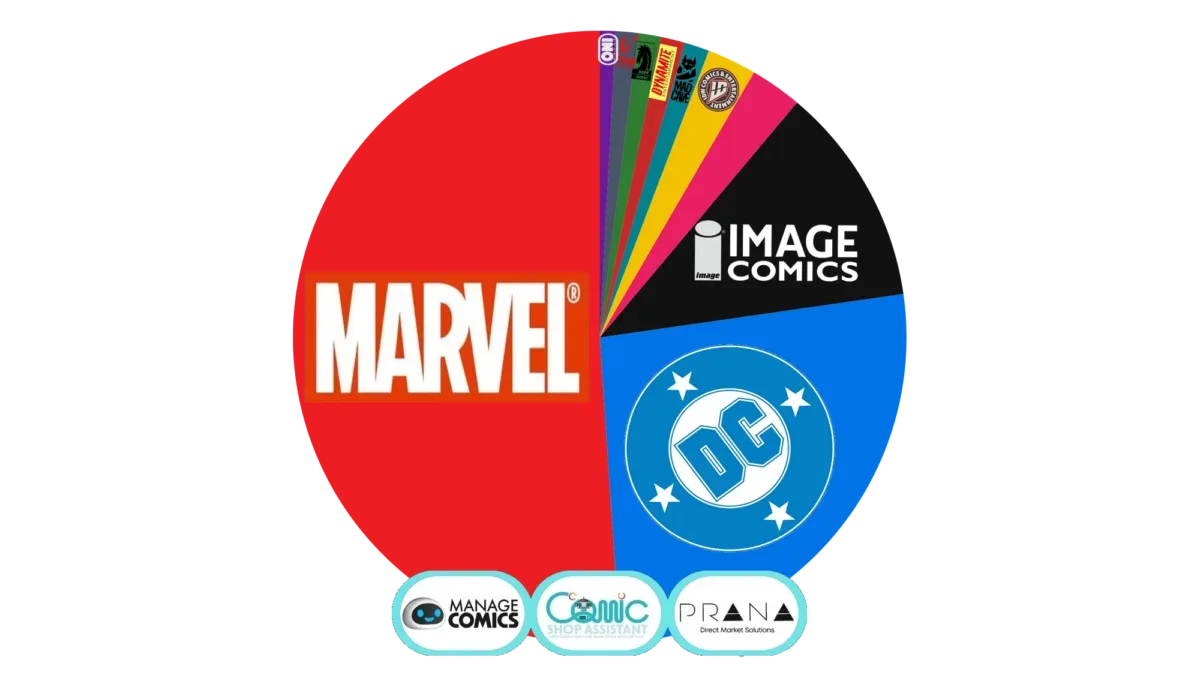
Outside the two largest publishers, Image held 11.61% of the measured weekly market. Boom followed at 2.73%, with IDW close behind at 2.60%. The remaining publishers each accounted for a smaller but distinct portion of sales.
- Marvel — 51.07%
- DC — 26.20%
- Image — 11.61%
- Boom — 2.73%
- IDW — 2.60%
- Mad Cave — 1.31%
- Dynamite — 1.28%
- Dark Horse — 1.19%
- Titan — 1.18%
- Oni — 0.83%
Publisher market share is an aggregate measure: it combines the sales attributed to all qualifying releases from a publisher in the reporting window. It is therefore different from the title index, which compares individual books to the week’s top-selling issue. Marvel’s high publisher percentage reflects both the singular impact of Amazing Spider-Man #1000 and the support supplied by several other high-ranking releases.
What the direct-market data does—and does not—show
The figures come from point-of-sale records from more than 600 stores using the Manage Comics and Comic Shop Assistant systems. The dataset covers direct-market comic shops and records a full Monday-through-Sunday sales week. It represents a substantial sample of the estimated 1,800 to 2,000 stores ordering through the direct market, but it is not a census of every shop or every way comics are sold.
Point-of-sale data means transactions recorded when customers buy items at participating stores. That is distinct from shipment or order data, which can indicate what retailers brought in but not necessarily what customers purchased during the same period. For a weekly snapshot of shop-floor activity, point-of-sale information is particularly useful. At the same time, it does not automatically cover digital storefronts, bookstores, libraries, conventions, or comic outlets outside the reporting systems.
That limitation is not a weakness unique to this week; it is simply essential context for reading the chart responsibly. The results show the performance of participating direct-market retailers, not a definitive count of every comic reader or every copy sold in all channels. They also capture a narrow window. A book that sells steadily over months may look less dominant than an event issue whose demand is heavily concentrated in its launch week.
Why this week stands out
Marvel’s 51.07% share is striking because it is both a publisher-level majority and the product of a visibly lopsided individual-title race. Amazing Spider-Man #1000 was the major accelerant, yet the rest of the top ten prevented this from being a one-book story. Marvel’s new launches, ongoing series, event material, and finale all contributed to the publisher’s unusually strong weekly showing.
DC remained the nearest competitor at 26.20%, with Absolute Batman #24 proving competitive against the strongest non-Spider-Man Marvel books. Image’s 11.61% also shows that the weekly market was not exclusively a two-publisher contest, even if the top end was overwhelmingly shaped by Marvel and DC.
The clearest takeaway is narrowly defined: during the September 29 through October 5 sales week covered by this sample, a landmark Spider-Man issue converted extraordinary title-level demand into a commanding Marvel share of comic-shop sales. Future weeks will have different release calendars and different leaders, but this one offers a sharp example of just how dramatically one event-sized comic can tilt a weekly direct-market report.