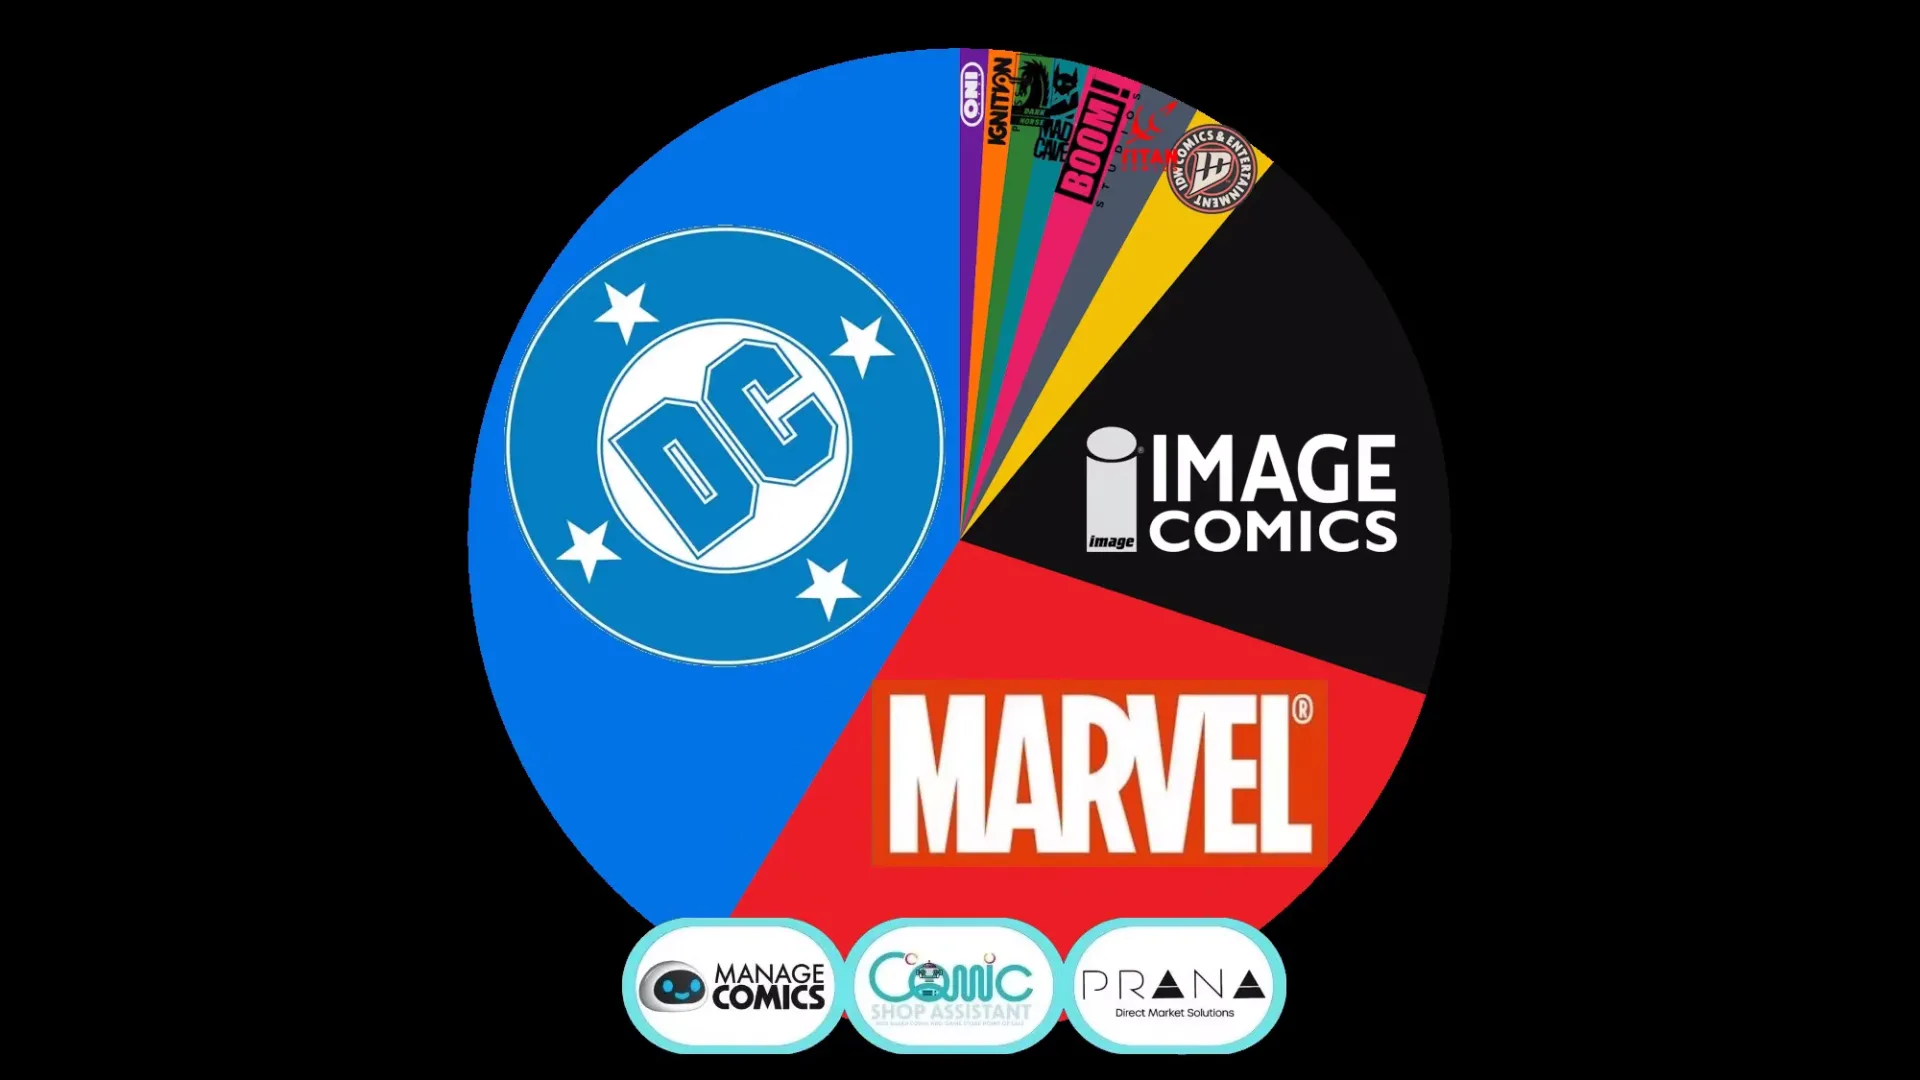

Comic-book sales charts have long carried an asterisk large enough to need its own variant cover: a high rank did not necessarily mean that readers had bought a high number of comics. It could mean retailers had ordered them. That distinction is central to a growing set of bestseller charts built from point-of-sale data, which record copies that participating stores actually sell to customers.
The change may sound like bookkeeping, but it changes the question being answered. Traditional direct-market charts chiefly described the business between distributors, publishers and comic shops. Sell-through charts instead attempt to describe demand at the counter. Both can be useful, but they are not interchangeable, and treating either as a complete portrait of the market can produce bad assumptions about a book’s popularity, a retailer’s risk or a publisher’s strategy.
Allyn Gibson, who produced Diamond Comic Distributors’ sales charts from 2009 through 2022, has argued that the newer sell-through figures are more useful despite their incomplete coverage and the estimation involved. His assessment matters because it comes from someone who worked with the older order-based reports rather than simply reading the rankings after publication.
Orders, shipments and sell-through are different measurements
The old Diamond charts tracked retailer orders and distributor activity, not a consumer walking into a comic shop and buying an issue. In practical terms, that makes them a measurement of sell-in: stock entering the retail channel. A sell-through figure measures stock leaving the shop through customer purchases.
Neither term is automatically more flattering or more damning. An order chart can reveal retailer confidence before release, the scale of a launch, and how much inventory publishers and stores expected to move. It can also show the commercial effect of a major relaunch, promotion or event before readers have had time to react.
But sell-in can be a noisy stand-in for audience demand. A store may order aggressively because it expects collectors to pursue a limited cover, because a discount makes a larger order attractive, or because it needs to reach a ratio threshold for a particular incentive variant. Those copies can sit unsold after the chart has already recorded the shipment as a success.
Sell-through charts ask a more grounded question: did a customer purchase the comic? If no customer purchase is logged at a participating shop, the copy does not bolster that book’s position in a point-of-sale chart. That approach reduces the impact of ordering incentives, retailer-exclusive variants and bulk arrangements on a ranking intended to show actual store sales.
The distinction resembles the gap between network traffic and the quality of the experience at the device using it. Traffic data can be valuable, but it does not alone tell you whether the important outcome occurred. That broader measurement problem also comes up in games and consumer technology; traffic-management tools can matter without being a complete solution. Comic charts similarly require readers to understand what is being measured before assigning meaning to a rank.
Why variants can complicate order rankings
Variant covers are alternate editions of a comic issue, often produced in limited quantities or offered through retailer-order incentives. A ratio variant, for example, may be available only after a shop orders a specified number of copies of the standard edition. That can prompt a retailer to order extra inventory to obtain a cover expected to appeal to collectors.
Such mechanisms do not make order data worthless, nor do they establish that every high-profile launch is artificially inflated. They do mean that a large order can contain several signals at once: enthusiasm for the story, anticipated collector demand, a retailer’s desire for a particular edition, and a calculation about discounts or resale. The chart number alone cannot untangle those motives.
Gibson described the potential effect starkly, characterizing some headline order totals as a façade when later issues dropped sharply. His broader point is not that every fall proves manipulation. Debut issues regularly attract attention that later installments do not. Rather, a first-issue order total should not automatically be read as a count of continuing readers.
That is where point-of-sale data can add useful context. If a book that dominates advance orders also sells strongly at participating shops over the relevant period, the two measures reinforce each other. If its order rank is huge but its sell-through standing is much lower, the difference may indicate that the launch mechanics and the reader market are telling different stories. It still does not prove why the gap exists, but it provides a better starting point for discussion.
How the newer charts are assembled
Current sell-through reporting draws from comic-store retail systems including ComicHub, Manage Comics and Comic Shop Assistant. These are point-of-sale, or POS, systems: software used by stores to record transactions. Rather than relying on a distributor’s report of what shops received, the charts aggregate sales records from participating stores.
One midweek-to-weekend chart uses sales from Wednesday through Friday supplied by more than 100 named direct-market shops. A separate “Wednesday Warriors” view uses actual sales data from roughly 120 to 150 comic shops through ComicHub. Weekly data covering Monday through Sunday is also available from 600 stores using the Manage Comics and Comic Shop Assistant systems through Prana Direct Market Solutions.
That is substantial information, particularly compared with a chart built on anecdotes or a single shop’s shelves. It is also plainly not the whole direct market. The available context puts the number of direct-market comic shops at roughly 1,800 to 2,000, while the relevant services operate worldwide but are concentrated mostly in North America and the United Kingdom. A participating sample can be highly informative without being a census.
Readers should therefore resist a new, opposite mistake: treating a sell-through chart as an exact national total or definitive measure of every store and every buyer. It represents sales captured by the participating systems and stores, across a specified window. Store mix matters. Regional demand matters. Whether a shop is represented matters. A comic can perform differently in stores outside the sample, and its sales through channels not represented in that POS dataset will not appear there.
Why incomplete data can still be the better tool
Gibson’s argument is fundamentally about usefulness rather than perfection. The older Diamond data was calculated from retailer orders and had the advantage of being based on the distributor’s own transaction records. That made it a robust picture of Diamond’s distribution activity at the time. However, it did not answer the question of what shoppers ultimately chose to buy.
The newer charts contain estimation and coverage limits, yet they record a result much closer to reader behavior. For creators and publishers trying to learn which books people are actually taking home, that can be more actionable than knowing only how many copies reached stores.
This does not eliminate the commercial importance of orders. Retailers must make ordering decisions well before knowing final demand, and publishers are paid within that supply relationship. The old incentive structure could prioritize extracting revenue from retailer orders even when stores risked holding unwanted inventory. Gibson said he had raised questions internally about whether processing and handling costs made certain variants worthwhile for the distributor, but that the issue was not pursued.
That observation points to a practical tension in the direct market. Publishers need retailers to commit early. Retailers need enough stock to meet demand without stranding too much capital in unsold comics. Customers want books available when they arrive. A well-designed public chart will not resolve those competing needs, but more transparent data can make the consequences easier to see.
The old index system and the missing totals
Diamond’s public charts did not routinely publish raw unit quantities. Instead, they used an Index Number, a percentage comparing a title’s sales to that month’s issue of Batman. Analysts could use the percentage and other available information to reverse-engineer, or closely approximate, unit estimates.
That method created a common language for monthly comparisons, but it also placed a layer between readers and the underlying numbers. The chart showed relative performance rather than a straightforward public count of copies. Gibson said the reports he received were consistent enough to use before 2020, although he did not always know every detail of how the figures were generated. He later became less confident about consistency after staffing changes during COVID and as Diamond’s former monopoly fragmented.
Those limitations are a reminder that data presentation is never neutral. A clean ranking can conceal a complex process: what universe of stores is included, what date range is used, whether the metric is orders or sales, and whether editions or versions are grouped together. Rankings are useful summaries, not self-explanatory facts.
What better comic-market reporting could look like
The most valuable future reporting would preserve the distinction rather than force a choice between old and new methods. A market could benefit from separate, clearly labeled charts for distributor orders and retail sell-through, alongside transparent notes on participating retailers, time periods and coverage. That would allow readers to see both initial retailer confidence and subsequent customer demand.
There is also an opportunity for broader cooperation. The current effort has indicated interest in adding data from other distributors, retail services and publishers while keeping competitively sensitive information protected. If that became possible, a direct-market order chart could again approach a whole-market view, while POS reporting could continue to show consumer purchases in the stores represented.
Until then, the sensible reading is neither “the old numbers were fake” nor “the new charts settle everything.” Order charts documented a real business transaction, but could be influenced by practices that did not guarantee customer sales. POS charts get closer to the reader purchase, but cover only the shops and systems contributing data. Put together, and interpreted with their limitations in view, they offer a clearer view of comics than either metric can provide alone.