

Absolute Cassandra Cain #1 was the top-selling comic by copies at participating direct-market comic shops during the week of September 15 through September 21, 2026. It is a notable opening-week result for DC, particularly in a sales snapshot that also includes books from Marvel, Image, IDW, BOOM! and other publishers.
There is an important asterisk beside the headline, though: DNX #1 ranked second in copies sold but generated more revenue than Absolute Cassandra Cain #1. The reason is straightforward: DNX carried a higher cover price. That contrast makes this a useful example of why comic-market charts need to be read with care. “Best-selling” can describe the most copies sold, the most money brought in, or some other measure entirely. Here, Absolute Cassandra Cain won the unit race, while DNX won the revenue race.
What the chart result actually measures
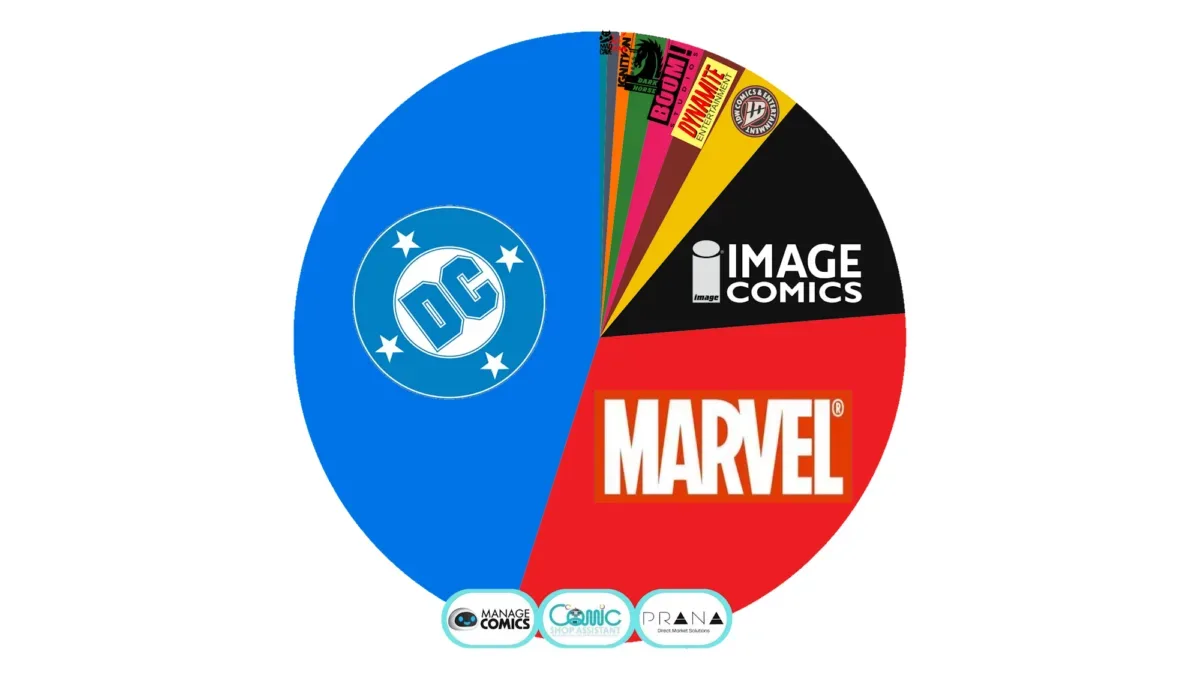
The figures come from point-of-sale data gathered from more than 600 comic stores using the Manage Comics and Comic Shop Assistant systems. The reporting window runs Monday through Sunday, meaning this result reflects sales recorded during that single September 15–21 week rather than advance orders, a publisher’s total circulation, or every comic sale in every format.
Point-of-sale data, often shortened to POS data, is the record created when a shop completes a sale through its register or retail-management system. For weekly rankings, that is valuable because it tracks books reaching customers at the counter. It differs from shipment or ordering data, which can show what retailers brought in but not necessarily what readers purchased during the measured period.
It is also a substantial but incomplete view of the direct market. The data set represents more than 600 stores out of an estimated 1,800 to 2,000 stores that order through that channel. In other words, the rankings provide a broad retail snapshot, not a literal census of every direct-market transaction. Stores outside the sample can have different local tastes, and sales from digital storefronts, bookstores and other channels are not established by this weekly store report.
Copies sold and revenue are not interchangeable
The difference between the two No. 1s is more than a trivia note. Unit sales tell us which issue moved the greatest number of copies within the participating shops. Revenue tells us which title generated the most dollars at its listed price. A book with a higher price can produce more revenue even when fewer readers buy it.
That matters for readers, retailers and anyone using charts to gauge momentum. A unit-sales leader may demonstrate wider immediate readership. A revenue leader may signal strong demand for a premium-priced issue, a larger format, or simply a book positioned at a different price point. The available data confirms the price difference affected the result, but it does not establish why DNX had that higher cover price or what specific edition format was involved. Those are details the weekly summary does not provide.
Likewise, the chart does not tell us the precise copy totals, dollar totals, or the gap between first and second place. It supports a clear conclusion about the order of finish—Absolute Cassandra Cain #1 first by copies, DNX #1 ahead on revenue—but not a precise calculation of either book’s market share.
A strong week for DC in a wide publisher mix
DC had a strong showing across the expanded top 400 list, with Absolute Cassandra Cain #1 at the front of the pack. The broader rankings also encompassed releases associated with Marvel, Image, IDW, BOOM! and other publishers, illustrating the range of material moving through comic specialty stores in the period.
For Cassandra Cain, a No. 1 issue leading the unit chart is especially consequential as an opening-week signal. Debut issues are often a focal point for retailers because they are where a new series establishes its early readership and where shoppers decide whether to add a title to their regular pull list. A pull list is a standing request for a comic shop to reserve forthcoming issues for a customer. The report does not reveal how many sales were pull-list reservations versus walk-in purchases, so it cannot separate committed regular readers from release-week discovery.
Still, the result puts the character and the Absolute line in a high-visibility position during the measured week. It also arrives amid a comic retail environment where individual issues, variant editions, collected formats and multiple publisher strategies can all shape demand. The only firm takeaway here is the chart placement, not the particular mix of factors behind it.
Why a weekly top 400 list is useful—and where its limits are
A list extending to 400 books has more value than a simple top 10 because it makes room for the long tail of direct-market sales: series that may not reach the very top but can still find a meaningful audience at specialty shops. It can show how multiple publishers coexist in a given week rather than reducing the market to a contest between only the biggest superhero launches.
At the same time, a sales chart should not be mistaken for a quality ranking. It does not measure critical response, long-term reader satisfaction, cultural impact, or the quality of the writing and art. It measures retail activity in the participating stores during a fixed seven-day period. A book can sell heavily in its launch week and later fall away; another can begin more quietly and build durable readership. This data alone cannot predict either path.
The same caution applies when comparing different types of releases. Cover price affects revenue; release schedules affect how many issues are competing in a given week; and an issue marketed as a first installment can operate under different retail conditions from a later chapter in an ongoing run. Those variables are not defects in the data. They are context readers should keep in mind before turning a weekly placement into an all-purpose verdict.
What comic readers and shops can take from the result
For readers looking to follow the week’s biggest direct-market releases, Absolute Cassandra Cain #1 is the clear unit-sales headline. Its first-place finish means it was the most frequently purchased comic in this data set over the reporting period. DNX #1 is the financial counterpoint: fewer copies than the chart leader, but greater revenue due to its higher price.
For comic shops, the split underscores why both measures matter. Copy volume is closely connected to how broadly a new issue is reaching customers. Revenue, meanwhile, reflects the dollars tied to those sales. Neither statistic replaces the other, and neither by itself reveals profitability, reorder activity, customer retention or sell-through against the shop’s initial inventory.
For the broader pop-culture audience, the result is another reminder that comics remain a weekly retail business as well as a storytelling medium. Characters and teams can carry attention across media; Marvel’s superhero world, for example, continues to generate major screen discussion around Avengers: Doomsday’s still-unannounced cast members. But this particular ranking is about physical comic-shop sales recorded in one defined window, with DC’s Absolute Cassandra Cain #1 leading on copies and DNX #1 taking the revenue edge.
That distinction is the week’s essential market story. Absolute Cassandra Cain #1 has the top unit-sales placement; DNX #1 brought in more money at the register. Both outcomes can be true at once, and together they offer a more complete picture than either headline would alone.