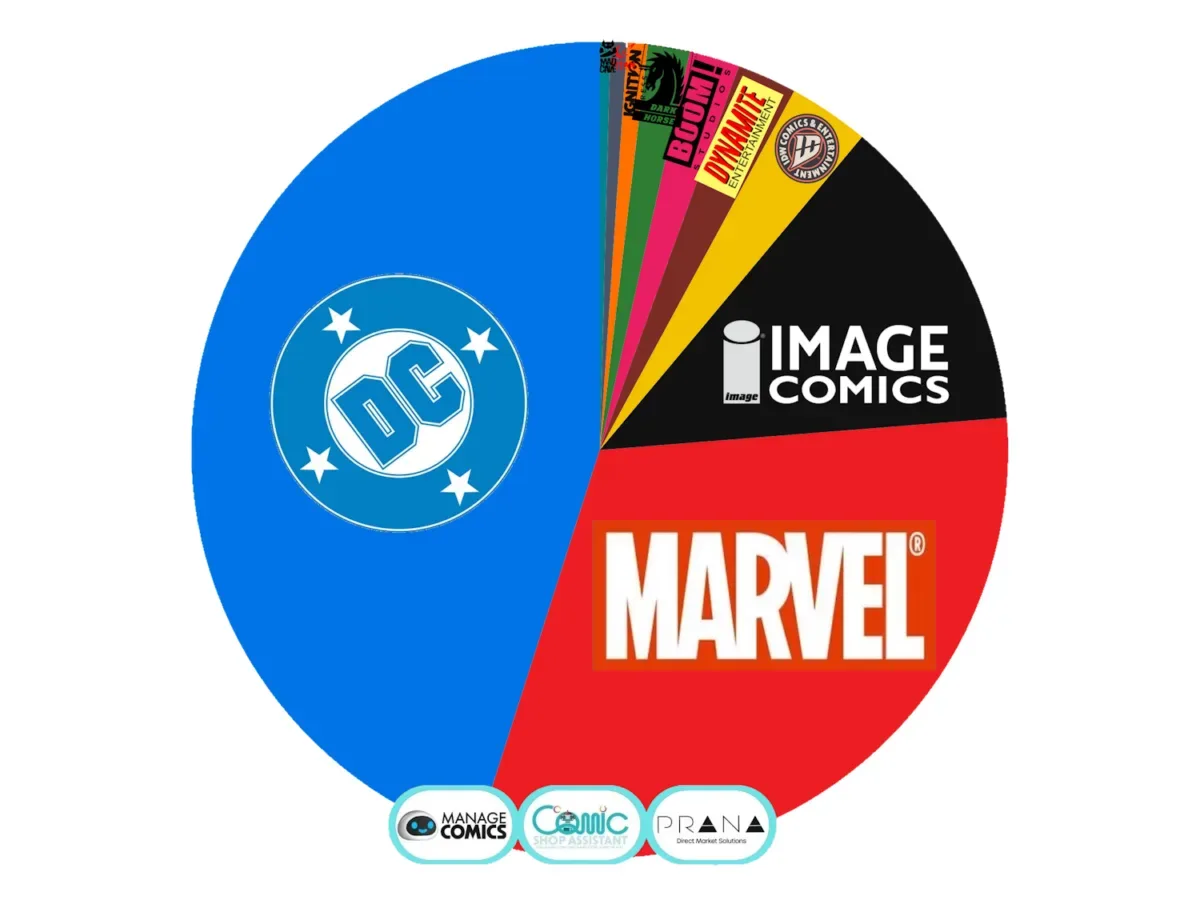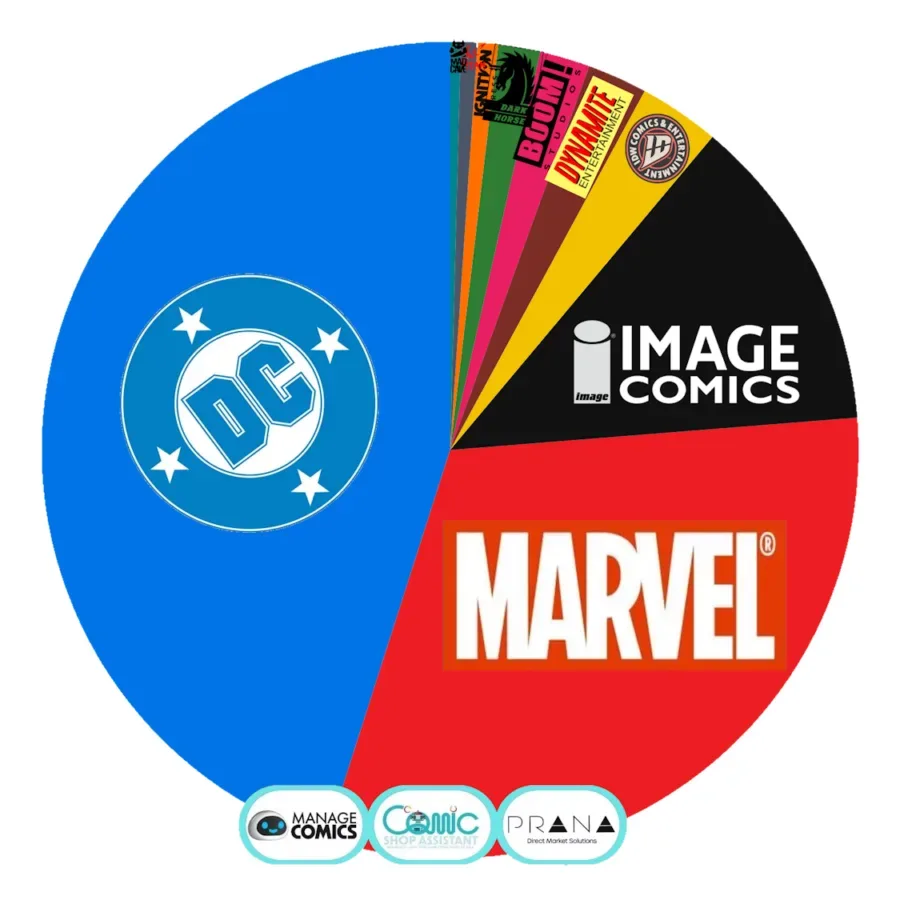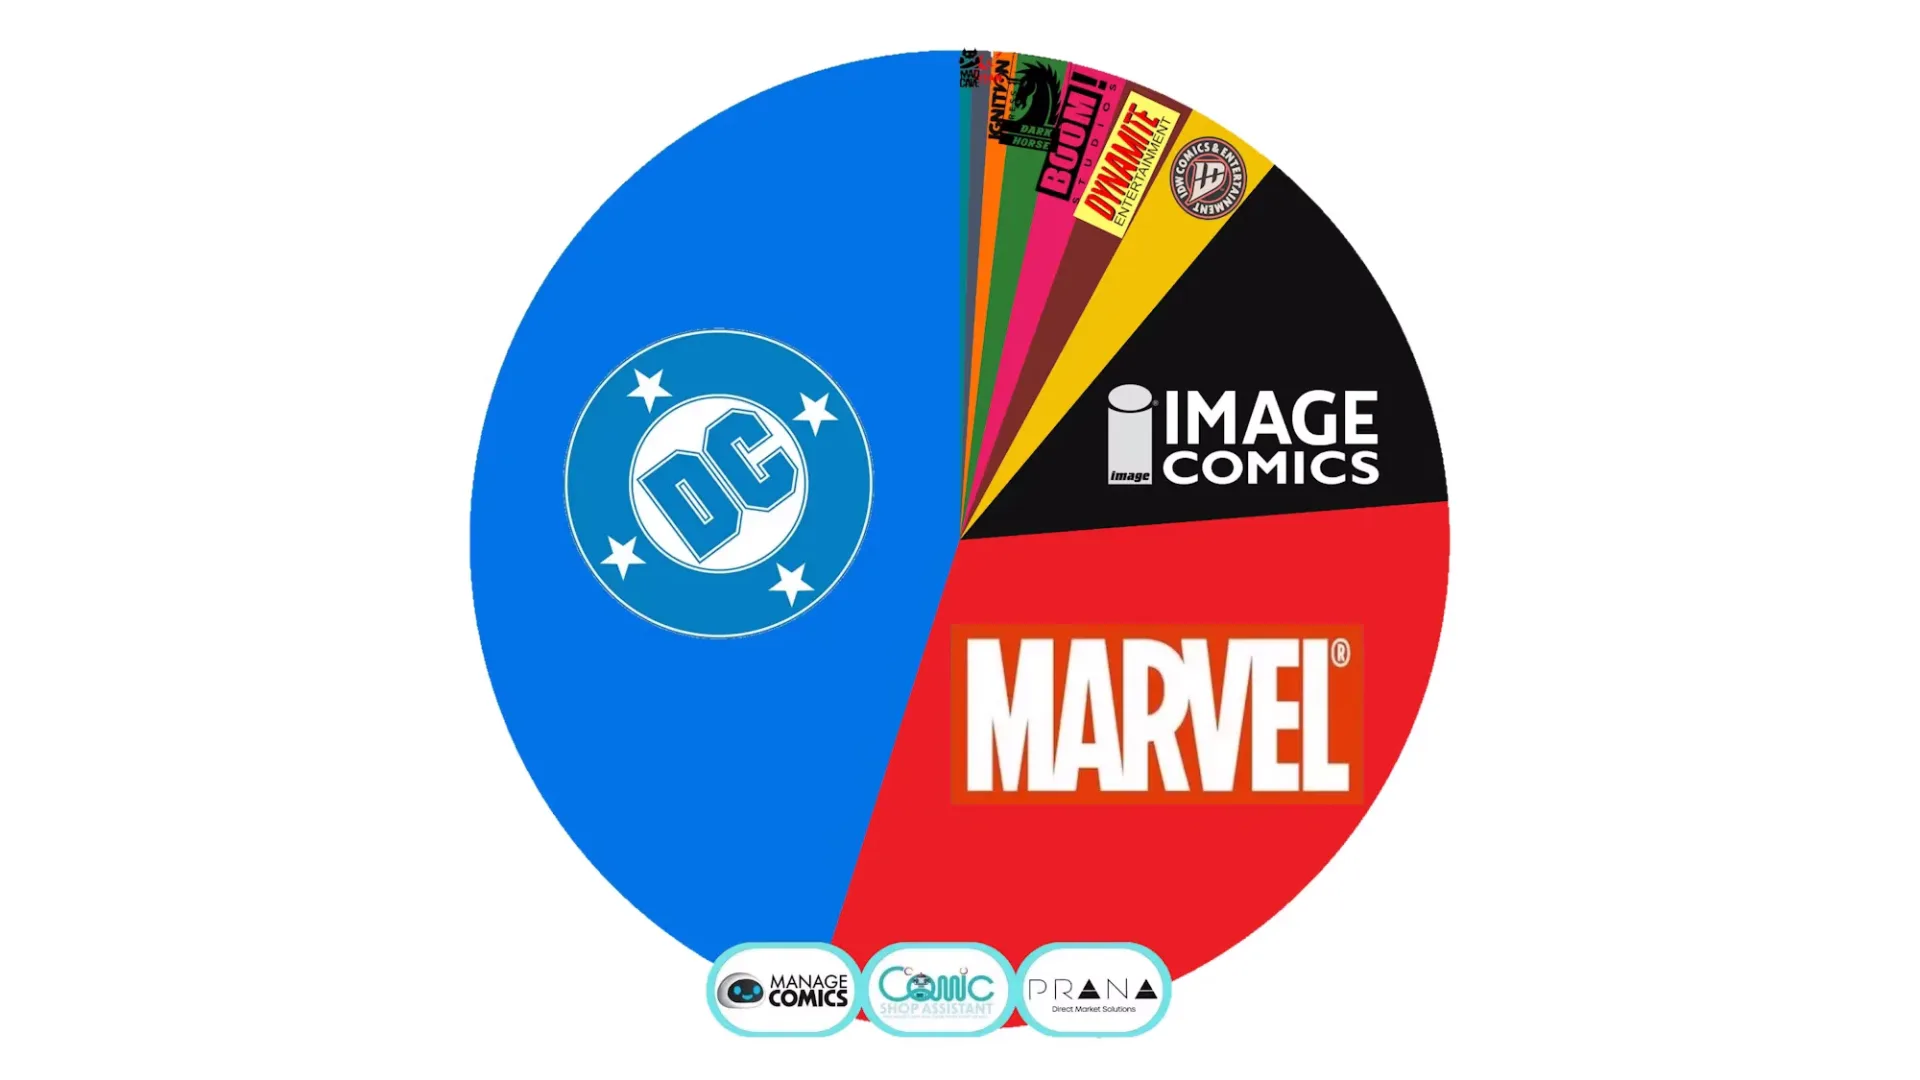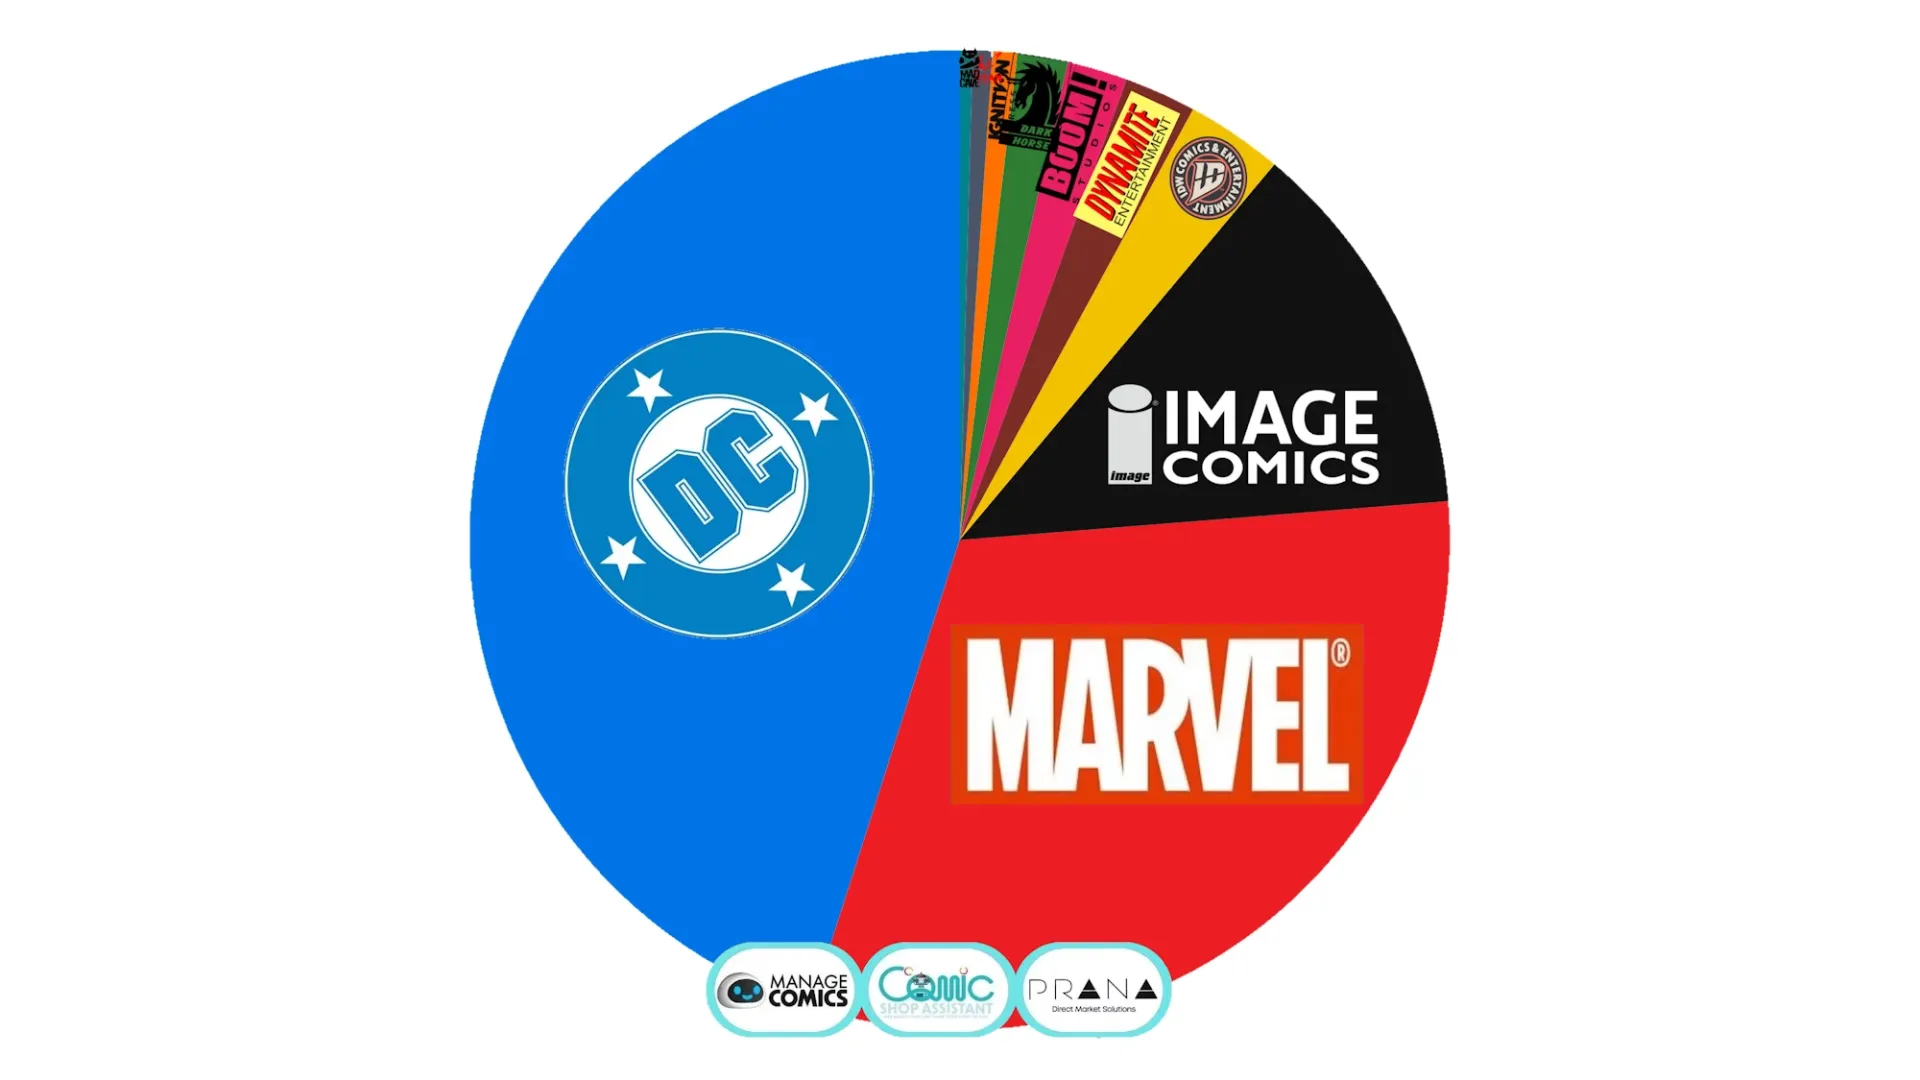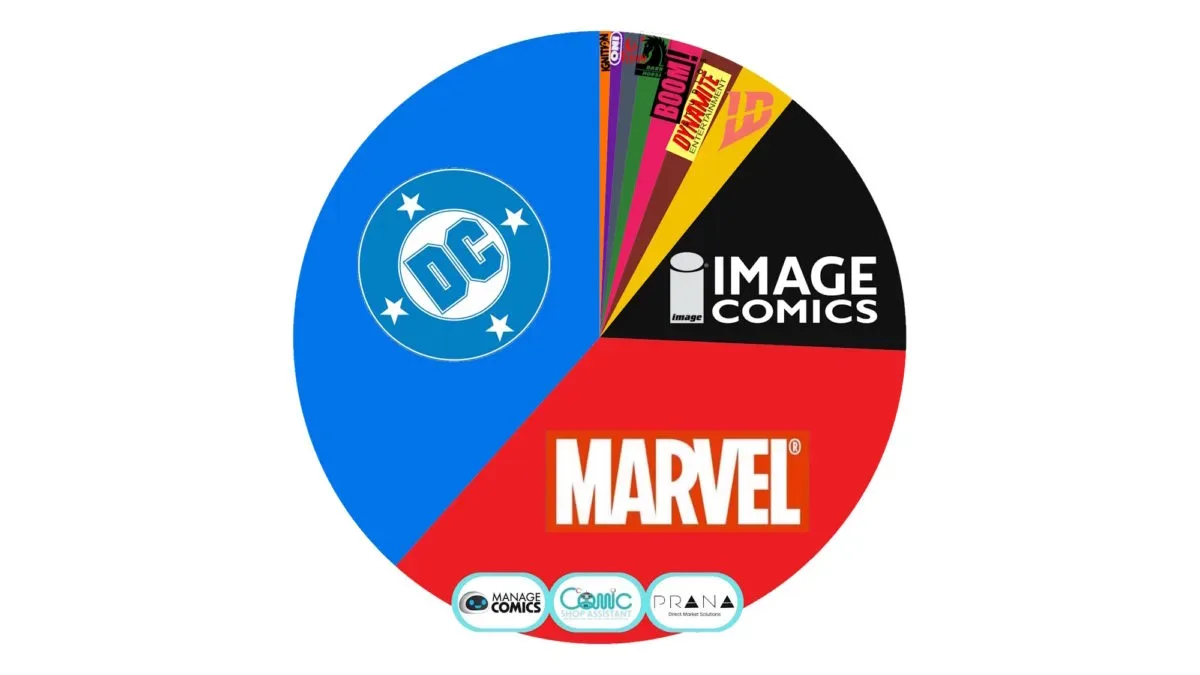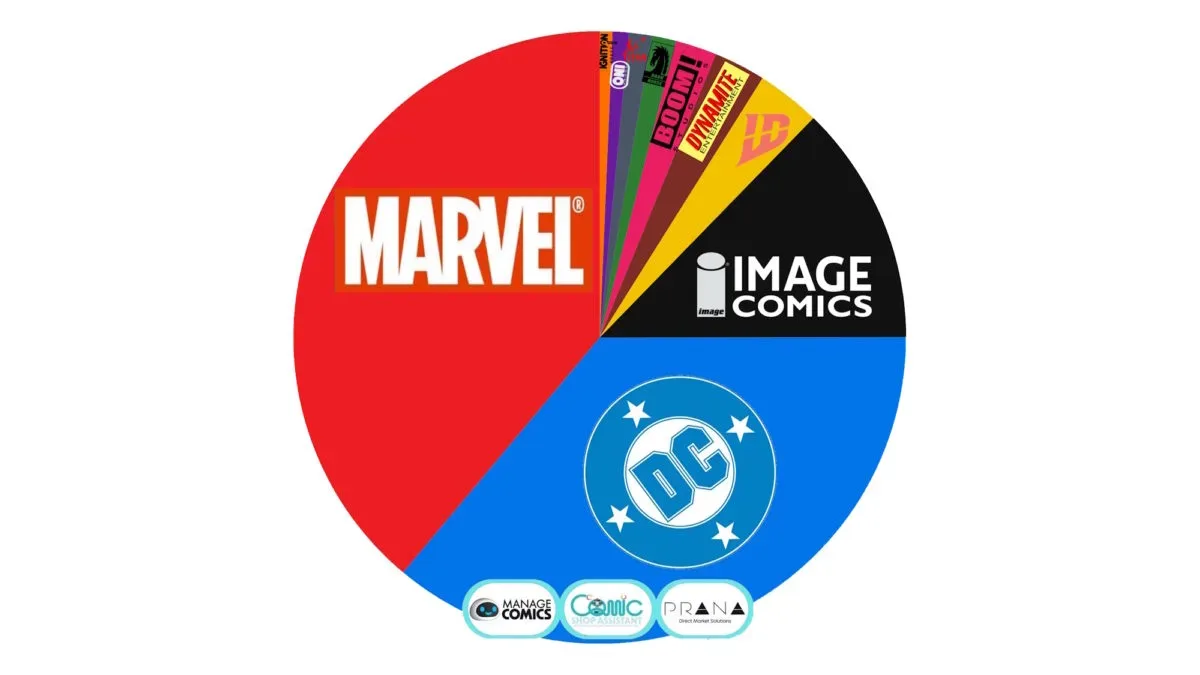

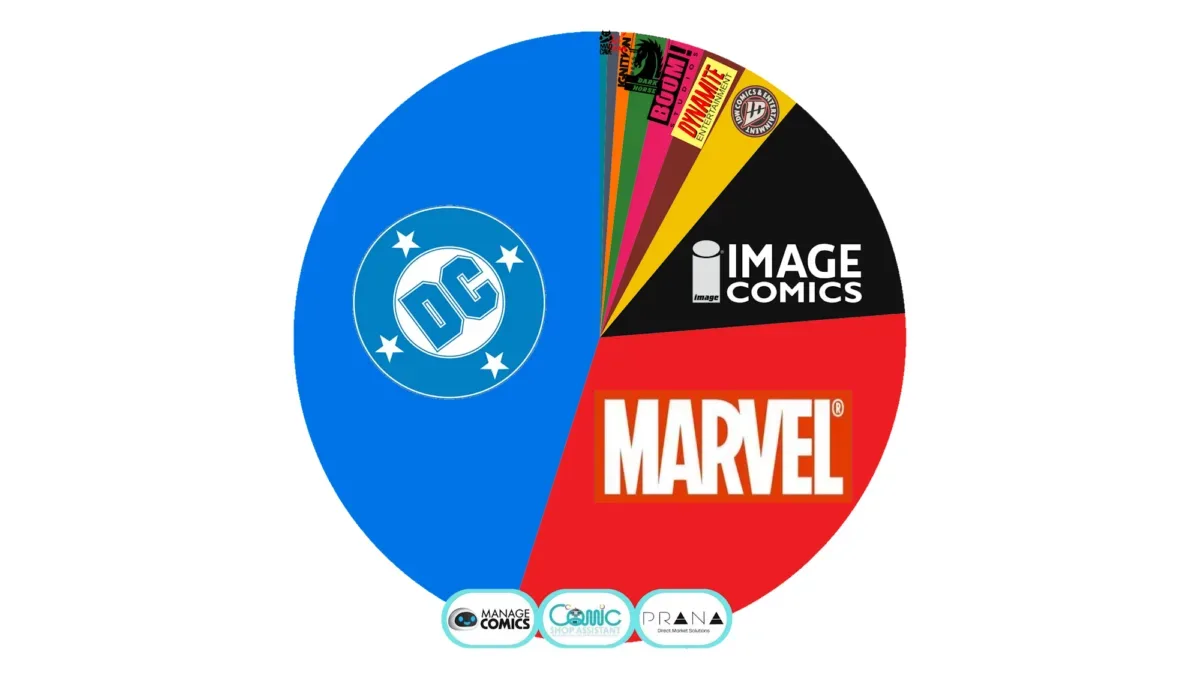
DC led the reported direct-market comic shop sales for the week of September 15-21, 2026, taking 45.53% of the market in a point-of-sale sample covering more than 600 stores. Marvel followed at 31.49%, while Image was third with 12.76%.
The numbers point to a particularly strong week for DC’s single-issue lineup, but the most interesting result sits at the very top of the chart: Absolute Cassandra Cain: The Shadow’s Hand #1 was the week’s unit-sales leader, while DNX #1 brought in more money. That is not a contradiction. It is a useful reminder that a bestseller chart can measure two different things—copies sold and dollars spent—and those measures do not always produce the same winner.
DC’s weekly share approaches half of reported sales
In the reported data set, DC’s 45.53% share put it 14.04 percentage points ahead of Marvel’s 31.49%. Image’s 12.76% share placed it comfortably ahead of the next group of publishers, led by IDW at 3.23%.
- DC: 45.53%
- Marvel: 31.49%
- Image: 12.76%
- IDW: 3.23%
- Dynamite: 2.39%
- Boom: 2.01%
- Dark Horse: 1.68%
- Ignition: 0.82%
- Titan: 0.66%
- Mad Cave: 0.42%
Market share, in this context, means each publisher’s portion of the sales represented by the reporting group during that one Monday-through-Sunday period. It is a measure of that sample’s activity, not a count of every comic sold everywhere. The underlying figures come from point-of-sale systems used by more than 600 comic shops; the direct market is estimated to include roughly 1,800 to 2,000 ordering stores. That makes the report a substantial weekly indicator, while also leaving it short of a complete industry census.
That distinction matters when reading any weekly chart. A strong percentage shows what moved through participating shops in a defined window. It does not, by itself, reveal sales through non-participating stores, other retail channels, digital editions, collected editions, or longer-term reorders.
Copies sold versus revenue: why DNX ranks above the unit leader in dollars
Absolute Cassandra Cain: The Shadow’s Hand #1 is listed as the reference point at 100% in the weekly bestseller comparison. DNX #1 reached 103.66% of that revenue figure, even though Cassandra Cain’s debut sold the greater number of copies.
The supplied explanation is straightforward: DNX #1 carried a $5.99 cover price, compared with $4.99 for Absolute Cassandra Cain: The Shadow’s Hand #1. A book with a higher price can produce greater sales dollars without taking the unit-sales crown. Put simply, the Cassandra Cain issue won on volume, while DNX #1 won on money generated in the chart’s comparison.
For readers and collectors, this is a practical chart-reading lesson. A revenue ranking should not automatically be treated as proof that a comic reached more individual buyers. Likewise, a unit-sales leader is not necessarily the item that generated the most revenue for shops or publishers. Cover price is one obvious factor separating the two results here.
It also explains why opening issues can make charts especially lively. A #1 issue gives retailers a clear entry point to stock and gives readers a clear place to start, but this report does not establish why customers selected either title. The defensible conclusion is narrower: both books were exceptionally prominent in the participating stores’ sales, with their victories coming through different measures.
The reported top 10
- Absolute Cassandra Cain: The Shadow’s Hand #1 — DC — 100%
- DNX #1 — DC — 103.66%
- Absolute Green Arrow #5 — DC — 89.16%
- Avengers Armageddon #4 — Marvel — 52.72%
- Daredevil #7 — Marvel — 46.52%
- Detective Comics #1113 — DC — 45.24%
- Exquisite Corpses: Fox Mask Killer #1 — Marvel — 34.83%
- X-Men #37 — Marvel — 33.59%
- Nightwing #142 — DC — 30.71%
- Batwoman #7 — DC — 30.21%
The percentage beside each issue is a relative revenue index, not a direct copy count. The 100% baseline is the Cassandra Cain issue. For example, the 89.16% beside Absolute Green Arrow #5 indicates revenue equivalent to 89.16% of the baseline title’s figure in this comparison; it does not mean the issue had an 89.16% share of the entire market.
DC held six positions in the top 10: both chart-leading #1s, Absolute Green Arrow #5, Detective Comics #1113, Nightwing #142, and Batwoman #7. Marvel held three listed positions through Avengers Armageddon #4, Daredevil #7, and X-Men #37.
There is one data-label wrinkle worth keeping in view. The accompanying summary describes Exquisite Corpses: Fox Mask Killer #1 as Image’s top-10 entry, but the detailed ranked list labels that same book Marvel. Because those two supplied listings conflict, its publisher placement should be treated as unresolved in this particular weekly presentation rather than used to draw a precise top-10 publisher count beyond the clearly identified entries.
What the chart can—and cannot—say about the week
The report offers a timely look at sell-through at participating comic shops: point-of-sale data records actual transactions, rather than only the quantities stores initially ordered. That makes it valuable for identifying which issues were actively moving during the week.
Still, one week is one week. DC’s near-half share is a notable snapshot of this reporting sample, not enough evidence on its own to establish a permanent shift in reader demand or publisher strength. Sales patterns can vary with a dense release slate, a high-profile debut, cover prices, retailer ordering choices, and the timing of purchases within a particular week. This data tells us the outcome, not the full mix of reasons behind it.
For comic-shop regulars, the immediate takeaway is simple: DC’s week was driven by a broad top-10 presence rather than a single isolated title. The Cassandra Cain launch delivered the highest reported unit sales, DNX #1 edged it in revenue on its higher cover price, and several established DC series joined them near the top of the list.
For anyone following comics as a medium rather than only as a chart race, it is also a useful prompt to distinguish popularity from price-weighted performance. The same habit applies across publishing: ask whether a ranking refers to units, revenue, orders, or transactions, then check the time span and the group being counted. Those details are often more revealing than a single ordinal position. Readers looking for another upcoming graphic-novel project can also see the planned Be Brave, Ruby B! graphic novel.
For September 15-21, however, the weekly picture is unusually clear: DC was the biggest publisher in the reported direct-market sample, and its two leading launches demonstrated exactly why unit sales and revenue deserve to be read as separate scoreboards.