

September’s U.S. game-market snapshot contains a familiar contradiction: players bought a great deal of new software, but the overall amount spent across games, hardware and accessories still edged down. Projected spending for the month reached $4.8 billion, a year-over-year decrease of 1%. Through September, spending stood at $41.0 billion, 3% behind the same point in 2025.
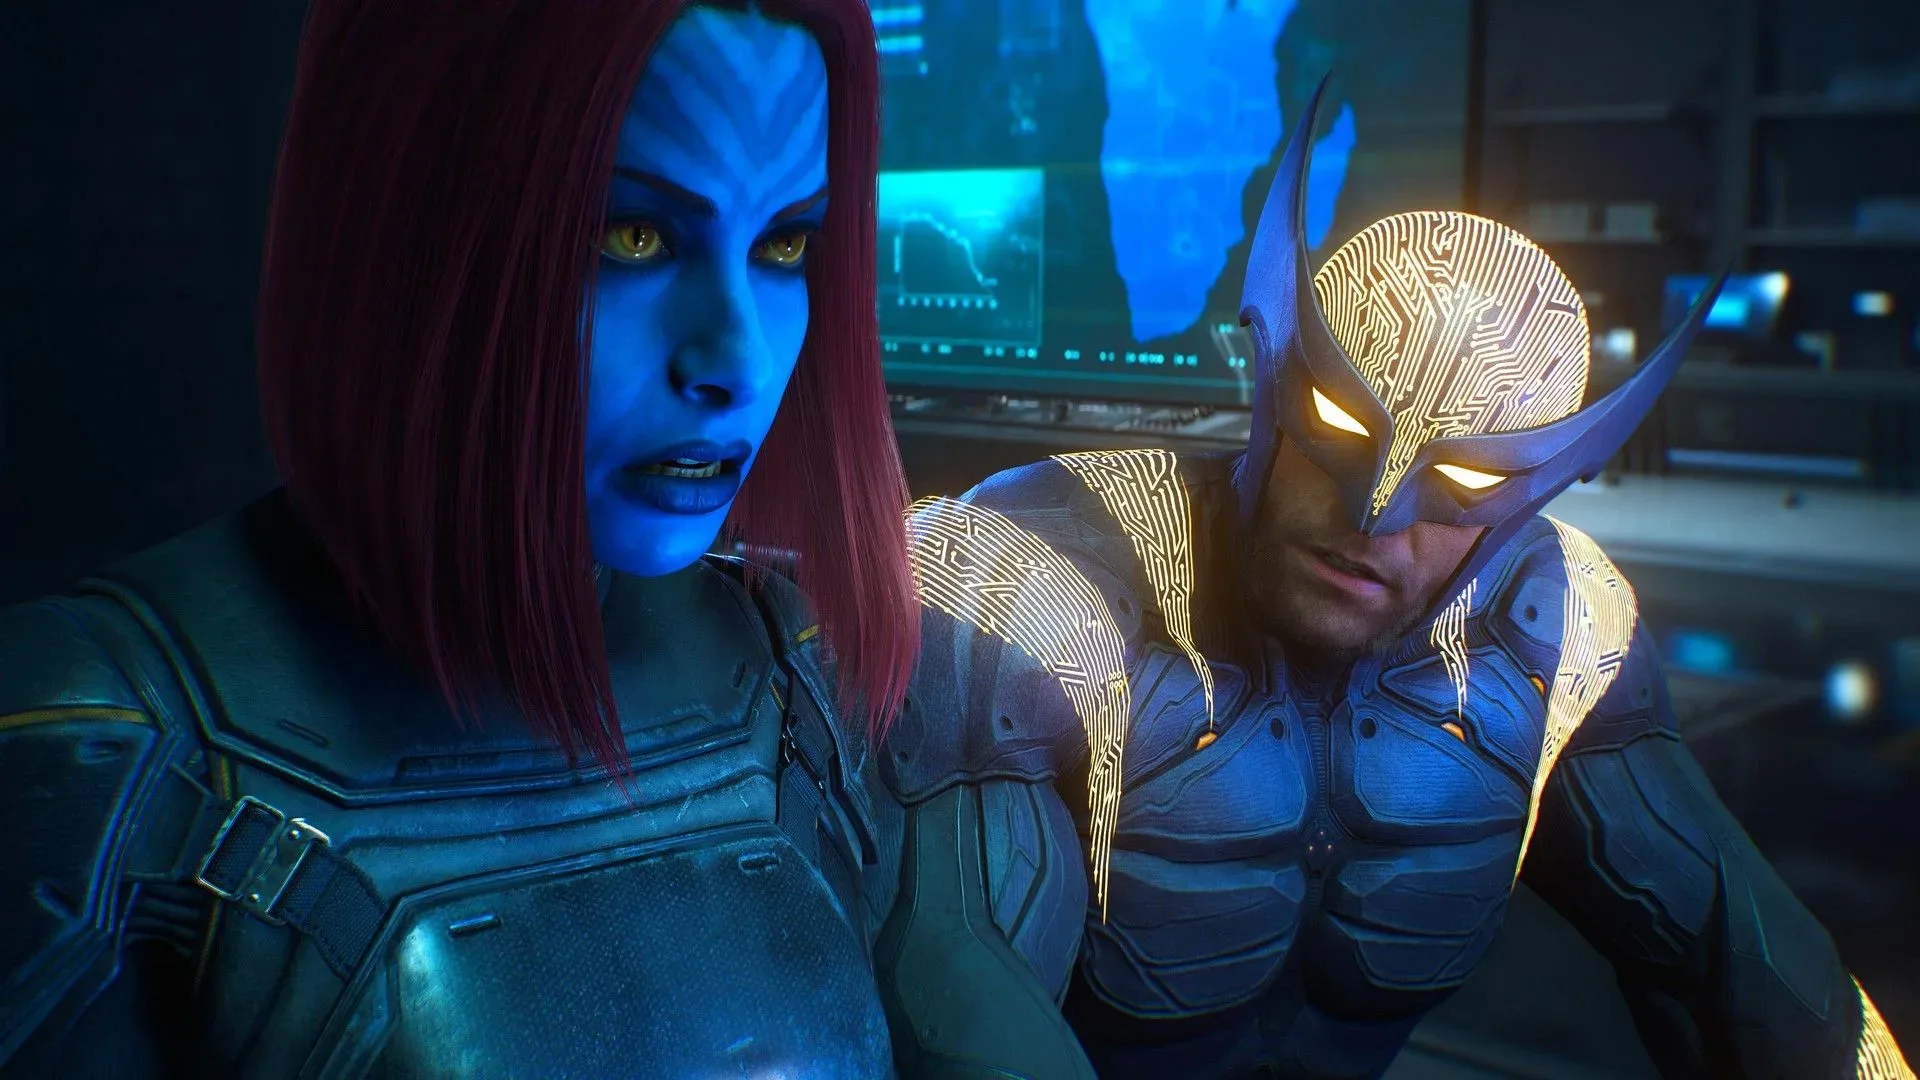
The month’s clearest software story is Marvel’s Wolverine. The Insomniac Games release finished as September’s top-selling game in the U.S., ahead of NBA 2K27 and EA Sports FC 27. It also reached No. 11 on the year-to-date ranking after just its launch month. For Sony, the result is particularly notable: its launch-month full-game dollar sales were its strongest for a published title since Helldivers II debuted in February 2024.
That gives September a more complicated reading than a headline about a 1% spending decline might imply. Software attention was concentrated around a wave of autumn releases, while the hardware side moved in sharply different directions for PlayStation, Switch 2 and Xbox Series. In other words, this was not a month without demand. It was a month in which the demand that did appear did not fully offset weaker spending elsewhere in the tracked market.
Wolverine wins a crowded month
Marvel’s Wolverine did not merely lead a quiet release calendar. September’s top-seller discussion was marked by new games rather than being dominated by older holdovers. Alongside established annual sports series, the new-release group included titles ranging from The Blood of Dawnwalker to Ace Combat 8: Wings of Theve. That mixture matters because it indicates that the month’s chart activity was spread across different kinds of releases: big franchises, sequels and newer properties all had a visible role.
The sales ranking covers physical and full-game digital dollar sales. It excludes mobile spending and digital add-on content. “Dollar sales” means the ranking is based on revenue, rather than simply the number of copies sold. A game’s position therefore reflects money generated by qualifying full-game purchases, not a direct count of players or units. It also means this chart is useful for comparing the commercial weight of releases within that defined segment, but cannot serve as a complete census of the entire games business.
Wolverine’s early result is also striking because it arrived despite a middling Metacritic score and without a planned PC release. The latter point narrows the game’s launch availability compared with a simultaneous multi-platform launch. A No. 1 finish and a place at No. 11 year to date under those conditions underline the commercial pull of the character, Sony’s platform audience and a major first-party release landing during the high-traffic fall window.
There is an important limit to what the figures can tell us. Strong full-game dollar sales do not establish why every person bought a game, nor do they indicate how players will respond over time. They do show that Wolverine converted launch-month demand at a level that put it ahead of two annual sports heavyweights in September. For a closer look at its regional digital-chart performance, see Marvel’s Wolverine’s PS5 digital-chart results in the U.S., Canada and Europe.
Software momentum did not lift the whole market
The 1% monthly decline is modest, but the year-to-date comparison provides broader context. At $41.0 billion, projected spending for the first nine months was 3% lower than 2025’s pace. September therefore improved neither the cumulative gap nor the underlying pressure on the overall total, even with a busy software calendar.
Related coverage includes September 2026 U.S. Game Sales: Wolverine Leads as Hardware Spending Slips.
That distinction is crucial. The market figure combines three separate areas:
- Content: spending on games and related game content within the tracked measure.
- Hardware: spending on the devices used to play games, including consoles.
- Accessories: spending on related gear.
A breakout game can produce a powerful software result without automatically making the total market grow. If purchases of consoles or accessories soften enough, the combined figure can still be flat or down. September is a practical illustration of that split: major releases supplied a lively full-game chart, while console unit trends painted a less uniform picture.
The source data are projections and estimates, so they should be read as a market measurement rather than a company earnings report. They are valuable for identifying relative performance and direction—such as Wolverine’s No. 1 placement or PS5’s year-over-year unit increase—but they do not expose every detail behind individual consumer decisions. The scope also matters: the cited top-10 ranking specifically excludes mobile and add-on content. A top-selling list is not the same thing as a complete spending breakdown.
PS5 rises while Switch 2 and Xbox Series fall
The hardware figures were markedly uneven. PlayStation 5 unit sales increased 22% year over year in September. Switch 2 unit sales fell 14%, while Xbox Series unit sales fell 27%. Unit sales describe the number of systems sold, rather than the revenue those sales produced. A platform can therefore see its unit movement differ from its dollar movement when prices, bundles or product mixes change.
For PlayStation, the 22% increase stands alongside Wolverine’s strong software debut and makes Sony the clearest positive hardware story in the month’s comparisons. The available information does not establish a single cause for the rise. The report floated the possibility that attention from the prior month’s Grand Theft Auto 6 Netflix reveal contributed to the PS5 bump, but that remains an interpretation rather than a demonstrated causal finding. September’s data show the increase; they do not prove which event, game or purchase incentive produced it.
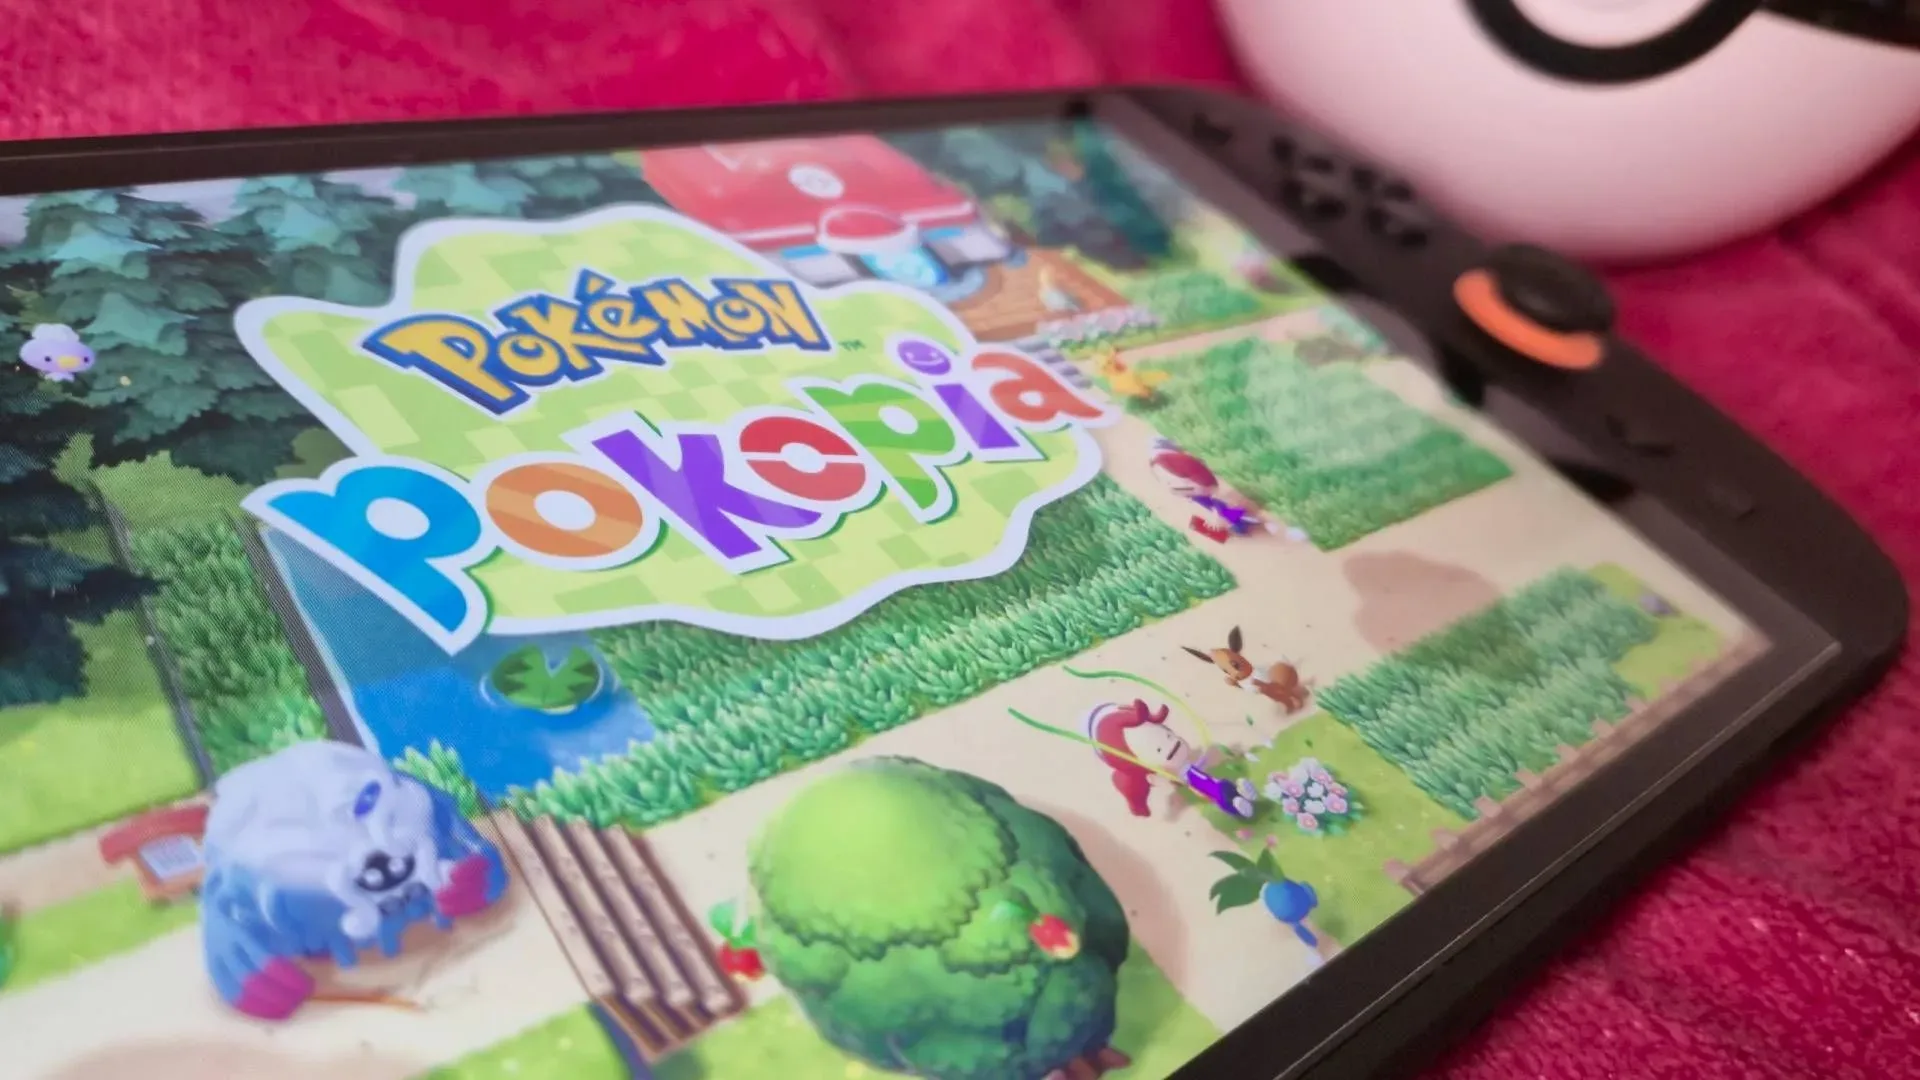
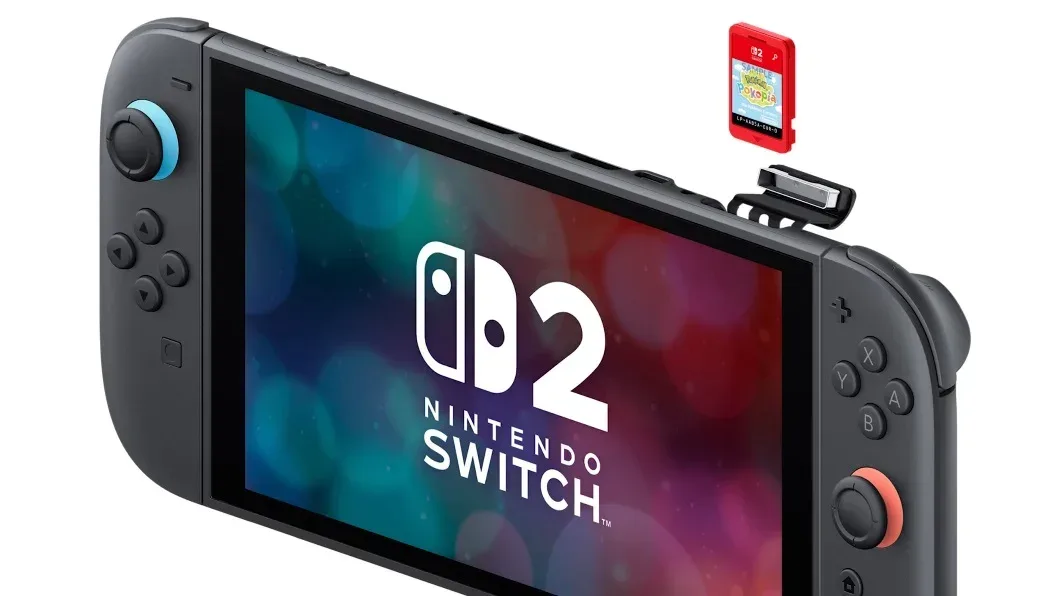
Switch 2’s 14% unit decline likewise arrived in a context where price pressure may matter, but should not be simplified into a final verdict on the system’s trajectory. A recent price increase was identified as a possible factor, while November’s planned release of The Legend of Zelda: Ocarina of Time could potentially change the picture. Those are reasonable factors to watch, not guarantees. The more immediate takeaway is narrow and clear: September unit sales were lower than a year earlier.
There is related context in the system’s spending mix. Average U.S. Switch 2 spending rose only 2% despite a $50 price increase, with bundle changes offered as an explanation. That reinforces why unit sales and spending should be kept separate when reading market reports. A percentage change in consoles sold does not independently explain what buyers paid per transaction.
Xbox’s decline puts price and supply under scrutiny
Xbox Series’ 27% year-over-year unit drop was the steepest of the three hardware changes cited for September. The backdrop described for Microsoft includes higher prices and supply-chain difficulties, both of which can make a weaker hardware result harder to reverse. Availability matters because an interested customer cannot buy a console that is not in stock; price matters because a more expensive console asks consumers to clear a higher threshold before they enter the ecosystem or upgrade within it.
The listed price gap is stark. An all-digital PS5 was priced at $600, while the comparable Xbox Series X began at $750. These are not a full comparison of every specification, bundle, promotion or ownership cost, and the available figures do not quantify the precise effect of the difference on demand. Still, the contrast explains why pricing is central to the Xbox discussion. When a competing device starts $150 lower, a buyer comparing current entry points has a straightforward financial reason to weigh alternatives carefully.
A reported outreach message to some inactive Xbox users added an unusual wrinkle: it allegedly encouraged them to resell their existing console through Best Buy so another person could acquire it at a discount. The report does not establish the message’s full distribution, purpose or eventual impact. It does, however, fit a moment in which console supply and value are prominent concerns. Resale programs may put hardware in the hands of new users at a lower cost, but they are not equivalent to new-console unit sales in a monthly hardware report.
What September actually signals
The best-supported conclusion is not that the game business is broadly weak, nor that one successful PlayStation release settled the platform contest. September shows a market moving in different directions at once. Consumers supported a deep slate of newly released games, with Wolverine leading the way. PS5 unit sales rose substantially from the prior year. At the same time, total tracked spending dipped, year-to-date spending remained behind 2025, and both Switch 2 and Xbox Series posted lower unit sales.
For players, the practical implication is that fall software demand remains healthy even while console purchasing becomes more selective. New releases can still cut through a packed calendar, but hardware price, availability and platform-specific release plans increasingly shape the route people take to those games. For publishers and platform holders, September emphasizes the difference between generating excitement around a release and converting that excitement into sustained growth across the wider hardware-and-accessories economy.
October and the approaching November release calendar will determine whether September was a short pause in total spending or part of a longer uneven stretch. What is already clear is that the launch of Marvel’s Wolverine gave Sony a major software win, while the hardware figures left a much less celebratory scoreboard for the market as a whole.