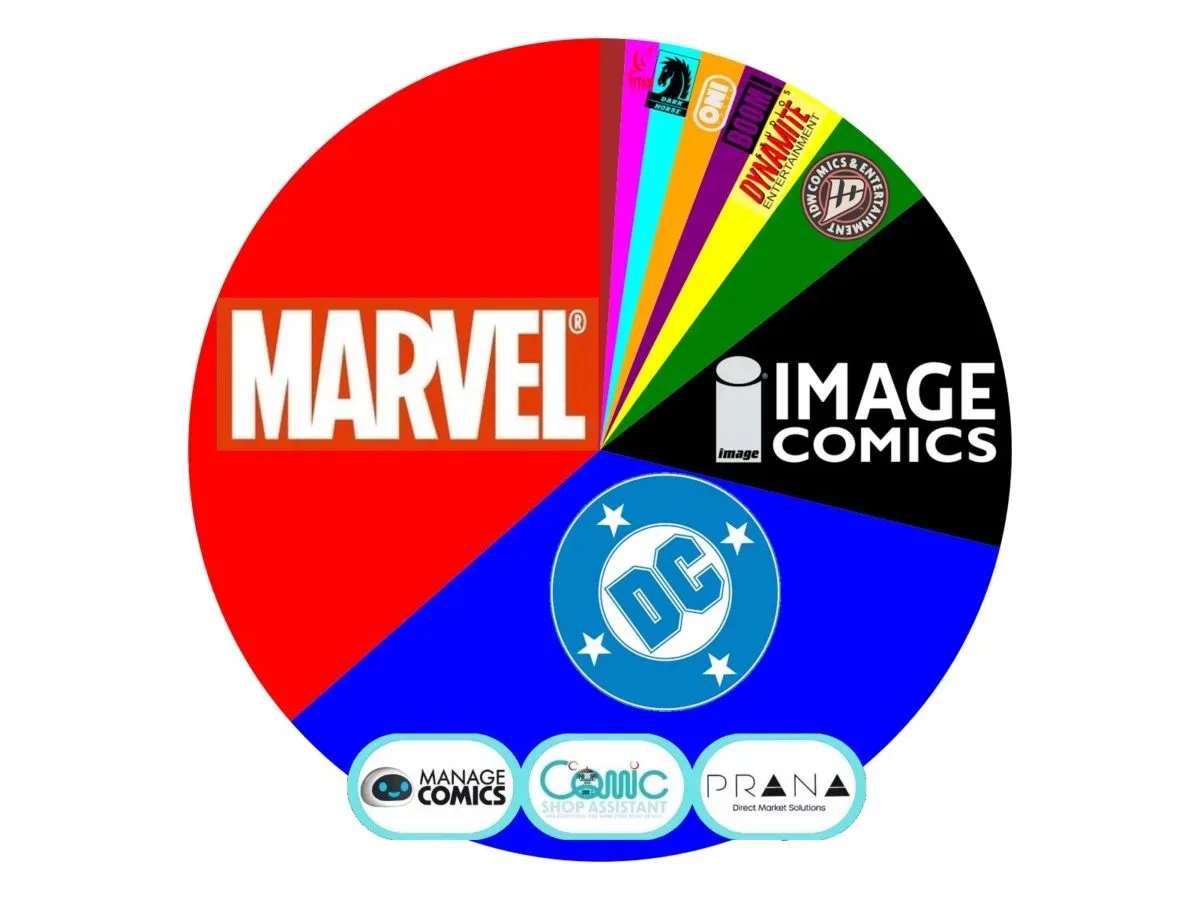

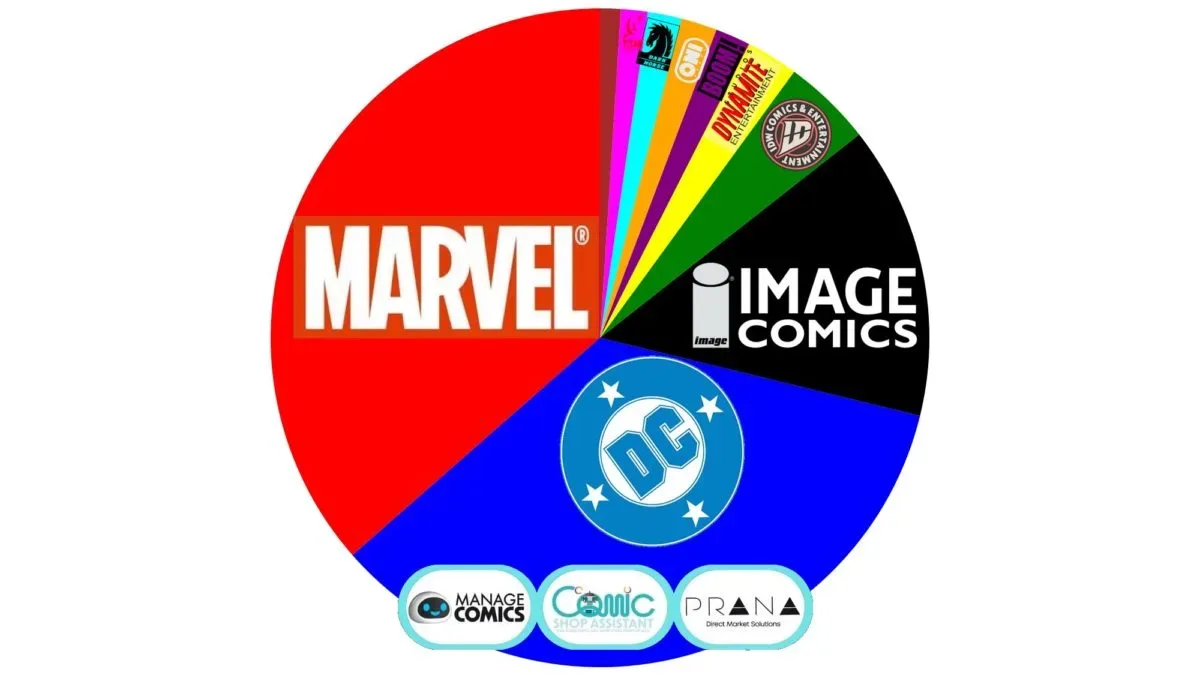
Marvel narrowly claimed the largest share of tracked comic-shop sales for the week of November 10 through 17, 2026, taking 36.46% of the market in a Point-of-Sale sample spanning more than 600 stores. DC followed at 34.72%, leaving a gap of just 1.74 percentage points.
That is close enough to make this less a story of outright dominance than of a tightly contested retail week. Marvel’s lead was supported by strong sales from Amazing Spider-Man, Daredevil, X-Men, and the continuing performance of Avengers #1. The leading issues were notably compressed in sales terms, with only slim differences separating many of the week’s biggest books.
Image held a substantial third-place position with 14.39% of tracked sales. Its standout was Transformers #38, which sold more copies than every DC comic in the sample. IDW also recorded a comparatively large 4.38% share, while the remaining publishers collectively illustrate how much weekly shelf activity exists beyond the two biggest superhero companies.
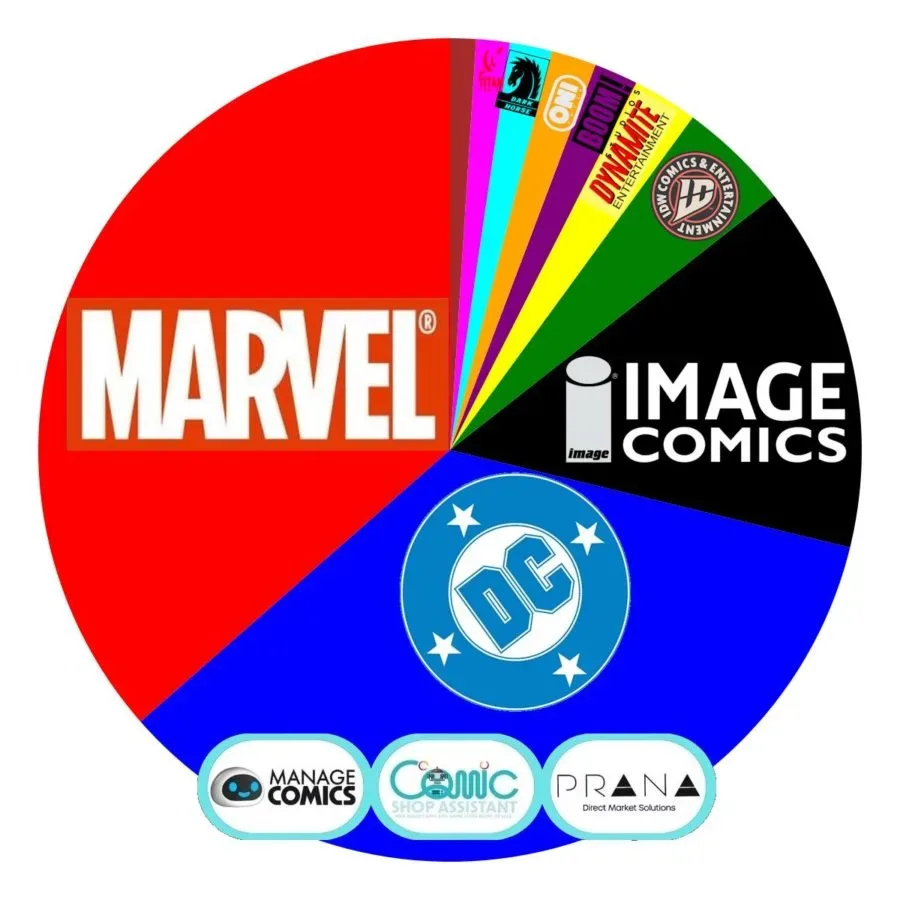
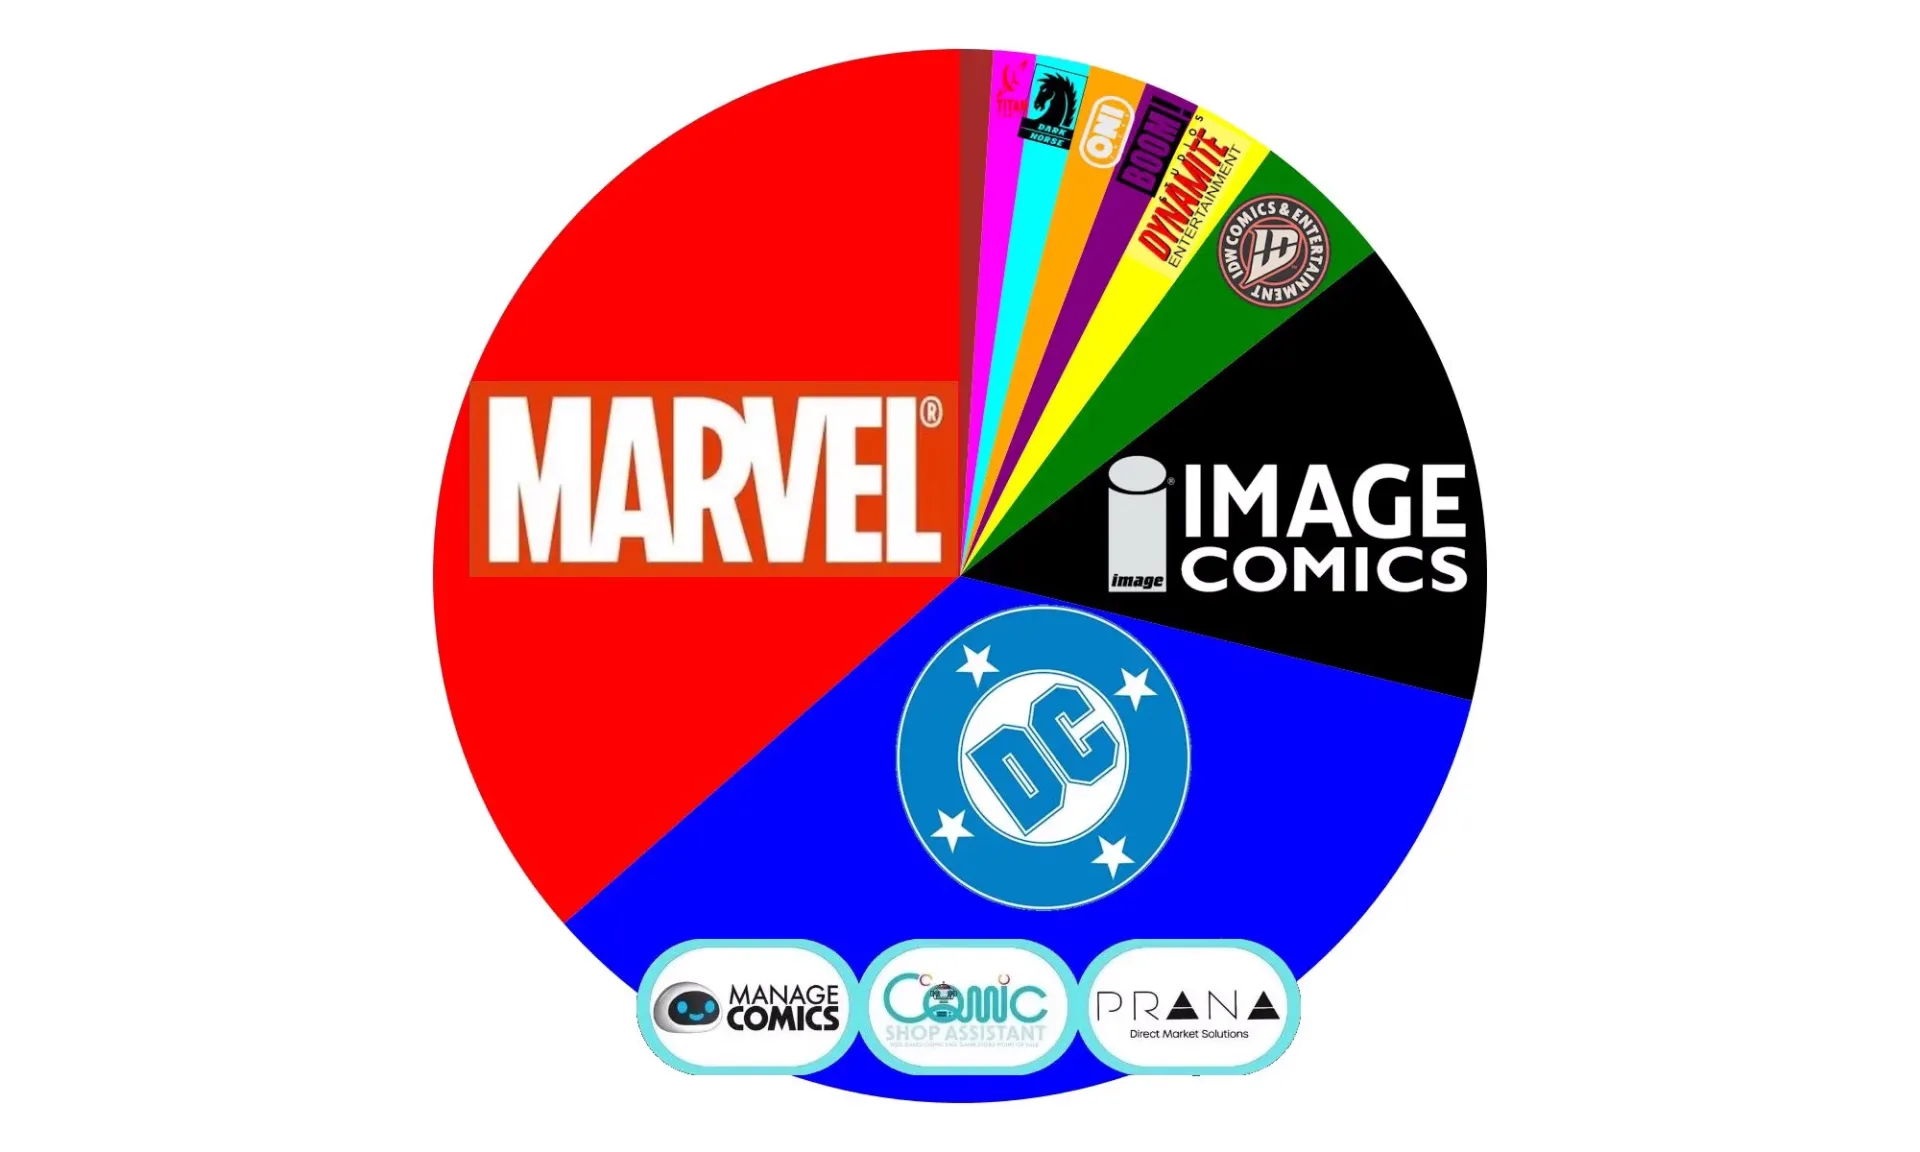
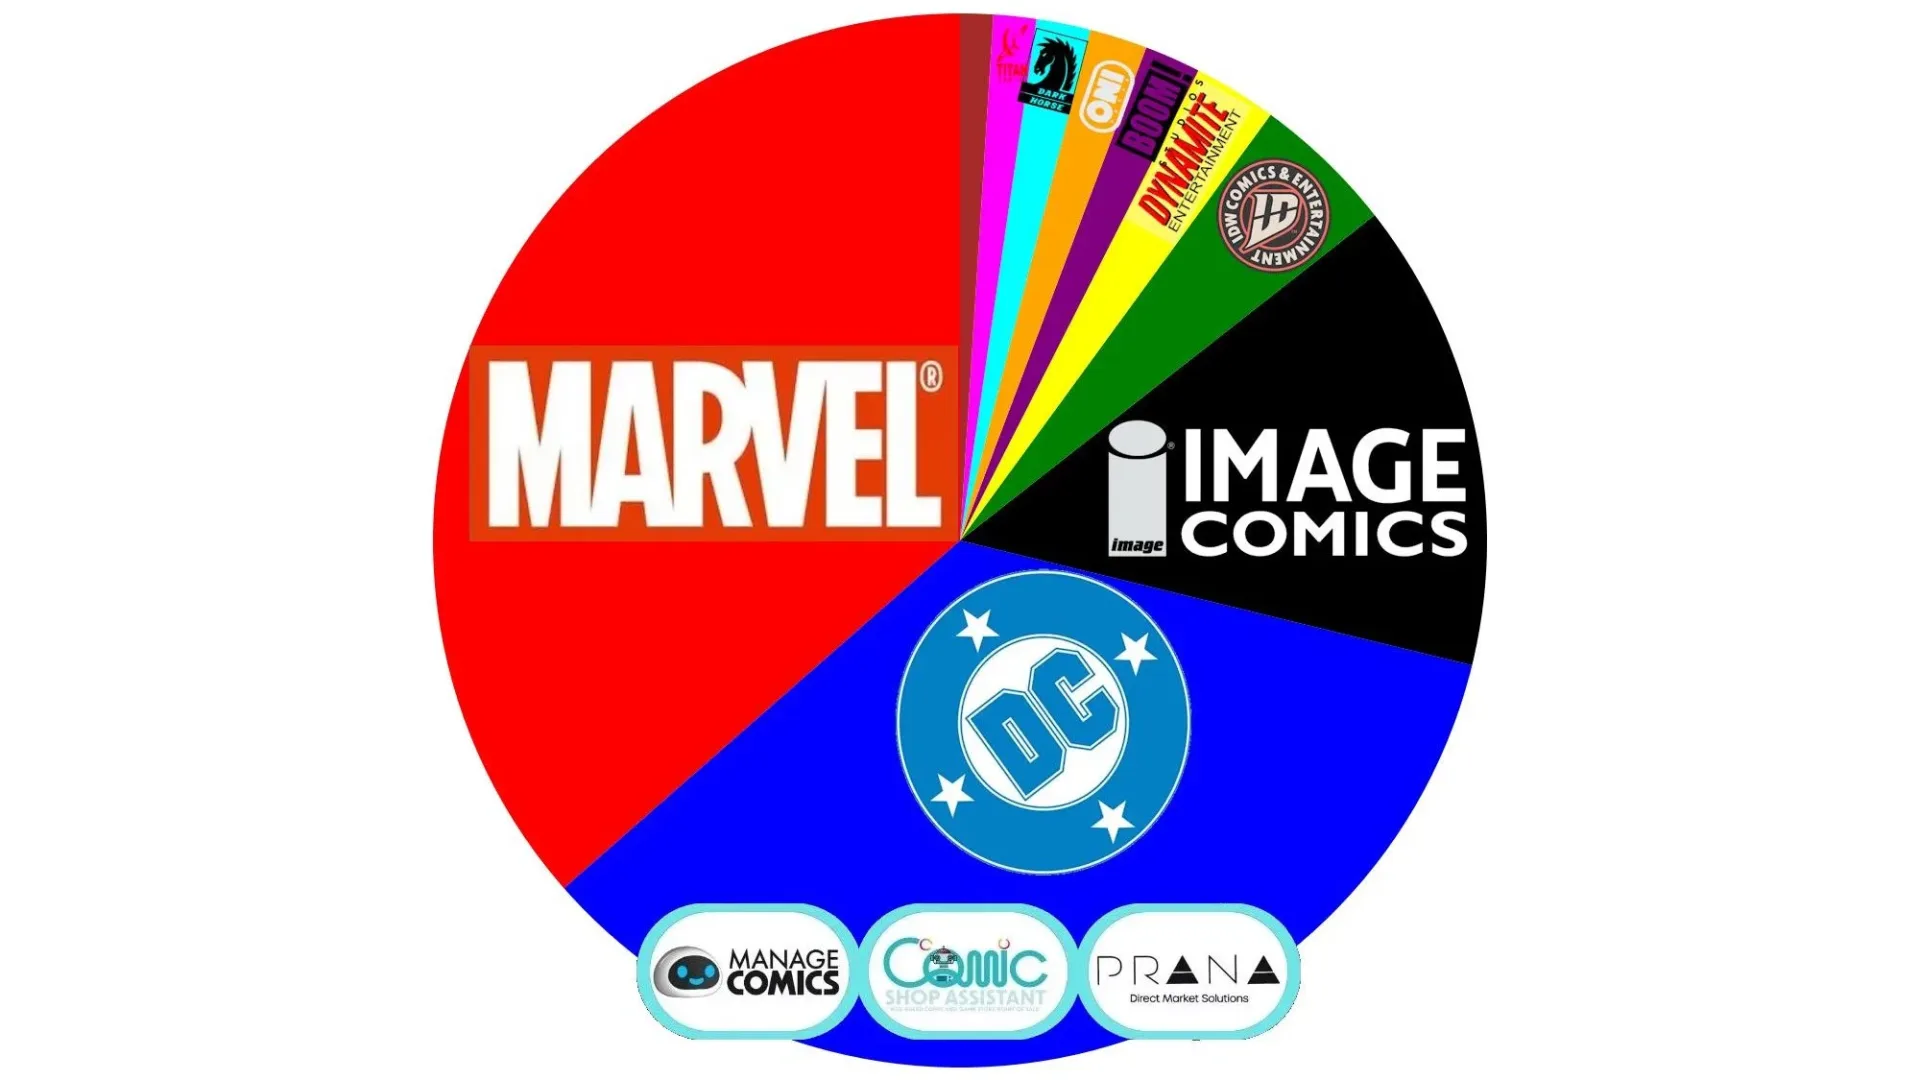
The comic-shop market shares
- Marvel: 36.46%
- DC: 34.72%
- Image: 14.39%
- IDW: 4.38%
- Dynamite: 2.56%
- Oni: 1.77%
- Boom: 1.72%
- Dark Horse: 1.66%
- Titan: 1.31%
- Other: 1.01%
Marvel and DC together accounted for 71.18% of the reported sales, so their near-tie defines the broad shape of the week. But Image’s 14.39% is meaningful in its own right: it amounts to roughly one sale in seven within this data set. The result for Transformers #38 gives that number a clear title-level anchor rather than making it merely a publisher-wide abstraction.
What “market share” means here
Market share is the percentage of all recorded sales attributed to one publisher during a stated period. It does not mean that a publisher sold that proportion of every comic purchased everywhere. The figures here come from Point-of-Sale, or POS, records: sales rung up by participating comic shops from Monday through Sunday.
That distinction matters. POS information tracks consumer purchases after books reach stores, whereas order data measures what retailers decide to buy from distributors. Both can be useful, but they answer different questions. A shop may order stock in anticipation of demand, then sell it across multiple weeks; POS reporting is focused on the copies that actually moved through registers during the measured seven-day window.
The sample combines data from the Manage Comics and Comic Shop Assistant systems and covers more than 600 shops. That is a significant slice of the estimated 1,800 to 2,000 stores ordering through the direct market, but it is not a census of every shop. Readers should therefore treat these percentages as a detailed view of participating-store activity, rather than a complete accounting of all comic sales or a definitive measure of every format and sales channel.
A close race with no giant separation at the top
The small Marvel-DC difference is the headline number, but the reported clustering among top-selling individual comics provides important context. A week with titles packed close together can look different from one driven by a single runaway release. In the latter situation, one exceptional issue can create a dramatic publisher advantage. Here, Marvel had enough high-performing books to finish first, yet the available data describes only a sliver separating many of the leaders.
That makes the 36.46% figure impressive without suggesting that Marvel was uncatchable. DC’s 34.72% was within striking distance. A change in the mix of new releases, ongoing sell-through, or shop-level demand could readily alter the ordering in another reporting week.
Avengers #1 continuing to sell after its release is also worth separating from a simple new-release chart. Ongoing sales of a first issue can bolster a publisher’s weekly total even after its initial launch period. The report identifies it as still selling well, alongside Marvel’s prominent Spider-Man, Daredevil, and X-Men titles.
Why Transformers is the notable individual result
Transformers #38 finishing ahead of every DC issue is a particularly clear indicator of Image’s strong week. It does not mean Image overtook DC at the publisher level; DC’s 34.72% remained well above Image’s 14.39%. Instead, it shows the difference between a publisher’s total sales across its line and the performance of a single comic.
Publisher market share aggregates every qualifying sale from that company in the sample. A title ranking looks at individual issues. DC could therefore place a large number of books across shops and still have no single issue exceed the sales of Image’s top Transformers release. Both statements can be true at once, and they are in this week’s data.
For readers following licensed and long-running comic properties, it is another reminder that the weekly conversation is not confined to Marvel-versus-DC superhero books. The broader market-share table includes publishers with very different catalogues, while the Transformers result shows a non-DC, non-Marvel title taking a conspicuous place at the individual-issue level. Fans interested in another upcoming comics-focused retail event can also see the announced Comics Giveaway Day 2027 lineup, which includes titles tied to TMNT, Sonic, Worm, and Zorro.
The middle of the market still counts
Below the top three, IDW’s 4.38% was the standout relative to its usual position in this type of weekly breakdown. Dynamite reached 2.56%, followed by Oni at 1.77%, Boom at 1.72%, Dark Horse at 1.66%, Titan at 1.31%, and the combined “Other” grouping at 1.01%.
These shares are smaller than the Marvel and DC totals, but they are not interchangeable. Each percentage represents sales that contribute to a more varied comic-shop week, and IDW’s result in particular signals stronger presence in the sampled stores than usual. The data does not provide a title-by-title explanation for every publisher’s percentage, so it would be speculation to assign the movement to a particular launch, creator, or promotion.
What shoppers and collectors can take from the figures
The weekly chart is most useful as a snapshot of demand, not an instruction to chase any issue. A high-sales ranking can reflect broad reader interest, a strong ongoing series, an effective launch, or continued sell-through after release. It does not, by itself, establish scarcity, future value, print quantities, or condition. Those are separate questions, and this data does not answer them.
For comic readers, the closer Marvel-DC contest and Image’s Transformers showing are useful signals of what was moving at participating stores during this particular week. For retailers and market-watchers, the report is a reminder to look at both levels of the chart: publisher-wide share explains the overall business mix, while individual title performance identifies the books pulling the most immediate attention.
Most of all, the November 10–17 numbers show a market that was competitive at the top. Marvel took first place, but only narrowly; DC remained nearly level; Image’s flagship performer outpaced every DC individual comic; and IDW earned an unusually robust portion of the recorded sales. That combination is more revealing than any one percentage alone.