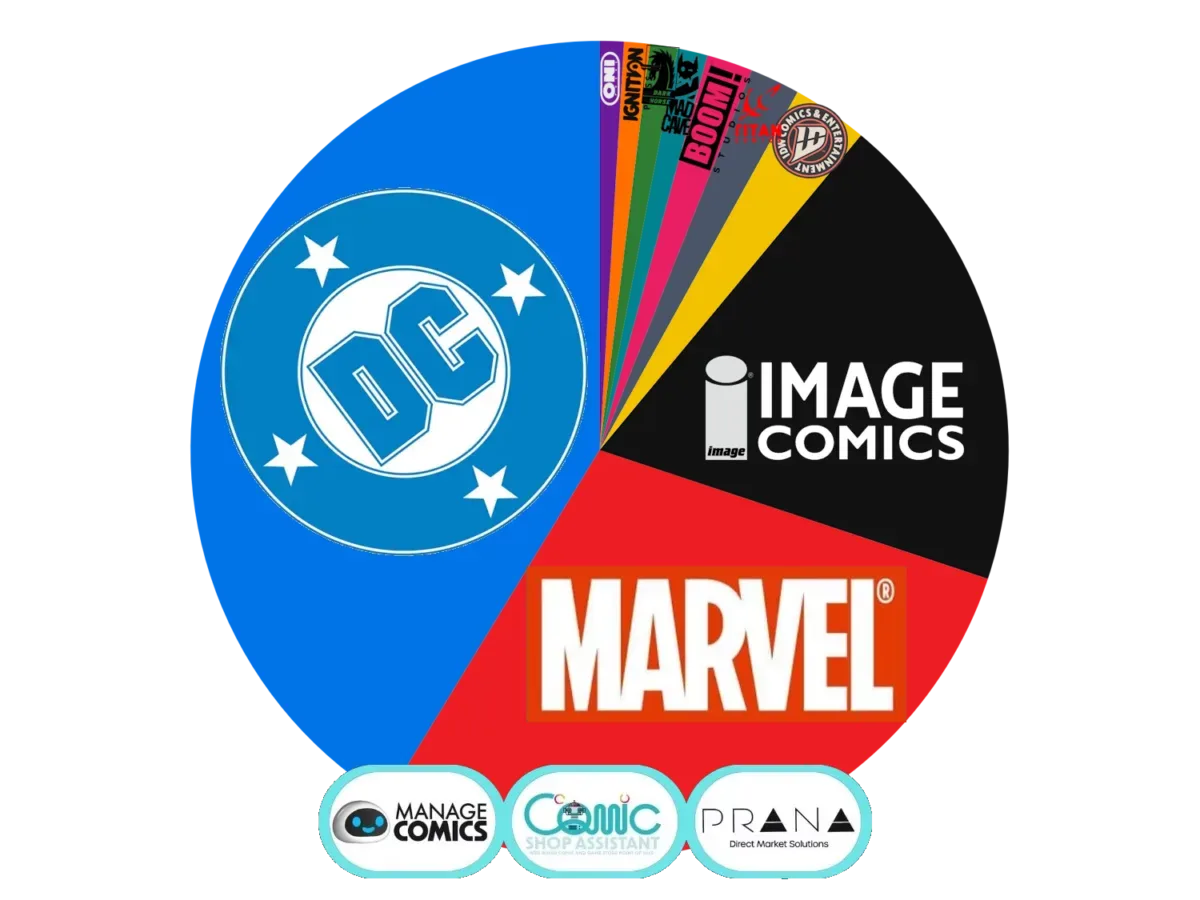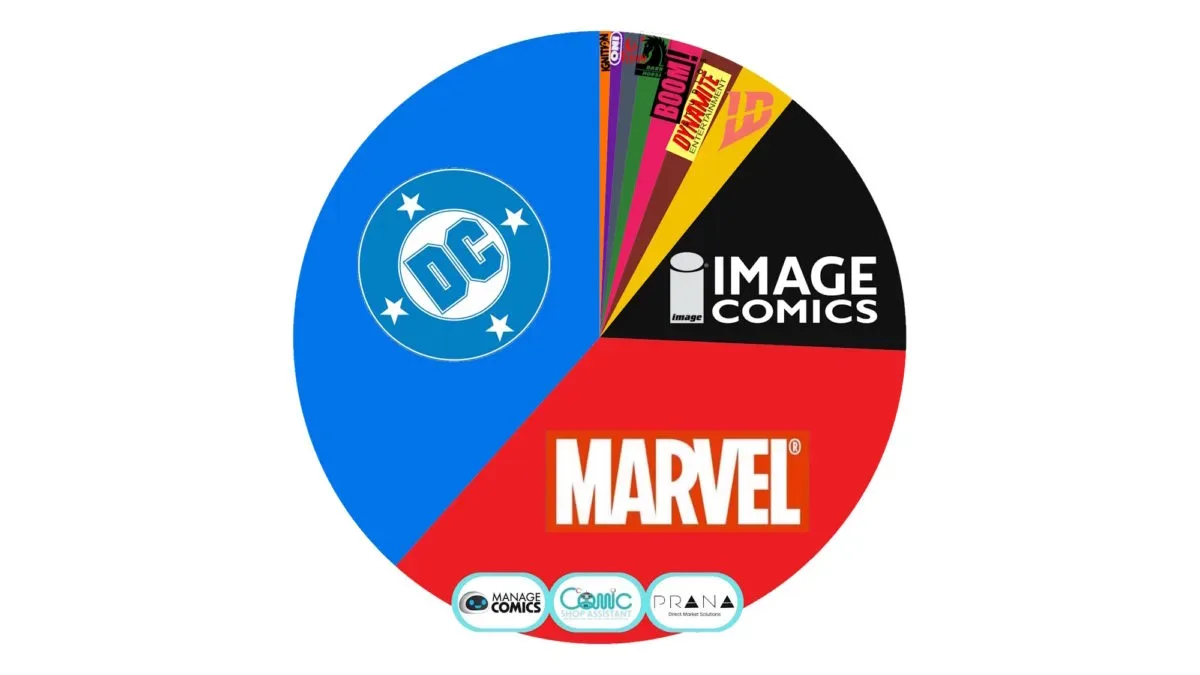

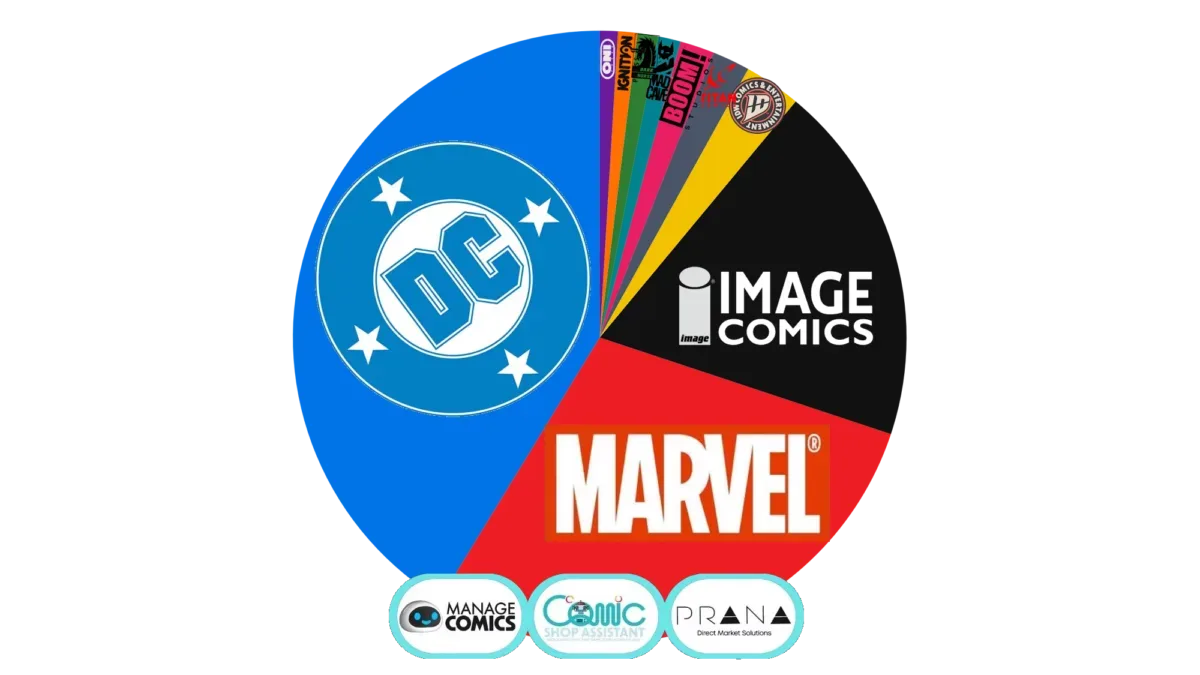
DC took the largest share of tracked comic-book store sales for the week of September 22 through September 28, 2026, led by a commanding performance from Absolute Batman #24. The publisher accounted for 41.29% of the measured direct-market revenue, while Marvel followed with 28.62% and Image took 19.07%.
That puts DC ahead by 12.67 percentage points over Marvel in this particular weekly snapshot. More strikingly, DC placed six books in the top 10, including the chart’s first- and second-place issues. Marvel claimed three entries, while Image’s Terminal #3 completed the list in eighth place.
The key caveat is scale. These figures represent point-of-sale sales from more than 600 participating comic shops using the Manage Comics and Comic Shop Assistant systems. The measured sample is substantial, but it is not a complete census of every comic sale or every direct-market store. The data is best understood as a view of the participating specialty-shop market during one Monday-to-Sunday period—not a universal ranking across digital comics, bookstores, libraries, or every retailer that may sell comics.
DC’s weekly share reaches 41.29%
Market share here means the portion of total sales revenue credited to each publisher within the tracked set of stores. It is not a percentage of units sold, nor does it show how many copies of an individual issue went to readers. A higher-priced comic can generate more revenue with fewer copies, while a lower-priced issue can move more units yet contribute less to a dollar-based market-share calculation.
DC’s 41.29% share means that, out of every tracked sales dollar in the reporting period, a little more than 41 cents went to DC titles. Marvel’s 28.62% equates to just under 29 cents per tracked dollar, and Image’s 19.07% comes out to roughly 19 cents.
- DC: 41.29%
- Marvel: 28.62%
- Image: 19.07%
- IDW: 2.99%
- Titan: 1.98%
- Boom: 1.81%
- Mad Cave: 1.19%
- Dark Horse: 1.09%
- Ignition: 1.02%
- Oni: 0.95%
The three largest publishers together represented 88.98% of the tracked revenue. That leaves 11.02% for the remaining publishers listed in the weekly breakdown, illustrating just how concentrated this particular sample was at the top.
DC’s position was supported by a broad top-10 footprint rather than a lone blockbuster. Absolute Batman #24, Absolute Wonder Woman #24, and Absolute Flash #19 all landed in the top five. DC also put Justice League Unlimited #23 at No. 7 and Superman #42 at No. 9. The result is a strong sign of sales concentration around the publisher’s Absolute line in the sampled shops that week, while its other superhero books also retained enough momentum to reach the upper ranking.
Absolute Batman #24 sets the pace
Absolute Batman #24 ranked first and serves as the 100% benchmark for the sales ratios in the chart. This does not mean it captured 100% of the entire market. Instead, every other title’s percentage shows its revenue relative to the top-selling issue.
Absolute Wonder Woman #24, the No. 2 book, recorded 41.43% of Absolute Batman #24’s revenue. That means the week’s leader brought in a little more than 2.4 times the revenue of the runner-up within this comparison. Marvel’s Muppets Take The Marvel Universe #1 came in third at 31.02% of the leader’s figure, followed by Infernal Hulk Vs Wolverine #1 at 26.31%.
The top 10 was:
- Absolute Batman #24 — DC — 100.0%
- Absolute Wonder Woman #24 — DC — 41.43%
- Muppets Take The Marvel Universe #1 — Marvel — 31.02%
- Infernal Hulk Vs Wolverine #1 — Marvel — 26.31%
- Absolute Flash #19 — DC — 23.0%
- Miles Morales Spider-Man #2 — Marvel — 18.69%
- Justice League Unlimited #23 — DC — 17.32%
- Terminal #3 — Image — 16.93%
- Superman #42 — DC — 15.63%
- Gambit Gone #1 — Marvel — 15.40%
The spread between the top book and the rest is large, but the lower end of the top 10 is tight. Superman #42 and Gambit Gone #1, for example, were separated by only 0.23 percentage points relative to Absolute Batman #24’s benchmark. That is a reminder that the ranking order alone should not be overread as a massive gap in demand between adjacent titles.
Marvel holds three spots, with two No. 1 issues in the upper half
Marvel finished second in publisher share and had three books in the weekly top 10. Its strongest entry was Muppets Take The Marvel Universe #1 at No. 3, followed by Infernal Hulk Vs Wolverine #1 at No. 4. Miles Morales Spider-Man #2 placed sixth, and Gambit Gone #1 rounded out the chart at No. 10.
There is a useful distinction between publisher market share and top-10 representation. DC’s 41.29% share and six placements point to both breadth and high-chart visibility. Marvel’s 28.62% share, meanwhile, came with four top-10 books in the supplied ranking, despite the weekly summary describing Marvel as having three. The individual list contains Muppets Take The Marvel Universe #1, Infernal Hulk Vs Wolverine #1, Miles Morales Spider-Man #2, and Gambit Gone #1, all marked as Marvel. The title-by-title chart therefore supports four Marvel entries, and it is the more precise count to use when reading this week’s lineup.
Marvel’s presence is also notable for the mix of issue numbers. Two of its charting releases are No. 1 issues, while its other two are early ongoing issues. A debut issue can draw attention because it offers an entry point, but the data does not identify why any book sold at its level. It cannot tell us whether buyers were responding to creators, characters, covers, retailer ordering patterns, price, or the appeal of a new series. The safest reading is simply that these four Marvel releases generated enough tracked revenue to make the top 10.
Readers following superhero media more broadly may also want to see how comic-book properties continue to sit alongside screen culture, including recent discussion around the MCU’s direction. That larger entertainment conversation, however, should not be mistaken for an explanation of a single week’s direct-market sales.
Image approaches one-fifth of tracked revenue
Image’s 19.07% share is the third-largest figure in the report and puts the publisher close to one-fifth of the observed sales value. Terminal #3 was its sole representative in the top 10, placing eighth with revenue equal to 16.93% of Absolute Batman #24’s total.
A single charting issue does not mean Image’s weekly result depended on only one title. Publisher market share aggregates the sales value of that publisher’s catalog across the participating stores, while the bestseller list highlights only the 10 highest-grossing individual comics. In other words, Image reaching 19.07% while appearing once in the top 10 suggests its tracked revenue extended beyond Terminal #3—but the provided figures do not show the individual books responsible, so no more specific conclusion can be made.
The same principle applies to every publisher outside the top 10. IDW, Titan, Boom, Mad Cave, Dark Horse, Ignition, and Oni all registered a percentage of weekly tracked revenue despite having no listed title among the 10 biggest sellers. A top-10 list is useful for identifying standout issues; market share is useful for measuring publisher-wide sales value. They answer related, but different, questions.
What this sales snapshot can—and cannot—show
The direct market is the network of specialty comic shops that order comics for sale to customers. Point-of-sale data records what was sold through participating retailers during the reporting window. This is meaningfully different from order data, which can reflect what shops purchased or reserved earlier in the supply chain rather than what shoppers bought at the register during a specific week.
That makes the weekly snapshot valuable for seeing sales activity in the sampled stores. Still, there are boundaries to keep in mind:
- It covers participating stores: More than 600 shops contributed data, from an estimated 1,800 to 2,000 stores ordering through the direct market. The sample is broad but incomplete.
- It measures a defined period: The numbers cover September 22-28, 2026. They do not establish a full-month or long-term trend on their own.
- It is revenue-based: The percentages concern money raised, not confirmed copy counts or readership.
- It is retailer-specific: Sales through channels outside the measured comic-shop systems are not established by these numbers.
- It is relative at the issue level: The bestseller ratios compare each title with Absolute Batman #24, rather than reporting raw dollar totals.
For collectors and readers, the practical takeaway is not that a top-10 placement automatically determines scarcity, future value, or creative quality. A weekly sales chart describes performance in a specific retail sample. It can spotlight which books had a particularly strong week, but it cannot, by itself, reveal print runs, remaining shop inventory, later demand, or the long-term health of a series.
For shops, the data can be a useful signal of where customer spending concentrated during this seven-day period. For readers, it highlights a week in which DC’s Absolute books dominated the top end, Marvel maintained several high-ranking releases, and Image held a substantial publisher share with Terminal #3 making the chart. The clearest fact remains the simplest one: in the participating comic shops tracked for September 22-28, DC led the field, and Absolute Batman #24 was the week’s biggest individual seller.