
Comic shops have spent years being asked whether the monthly floppy is dead, dying, merely resting, or hiding behind the counter with a variant cover. Fresh point-of-sale figures suggest a more useful question: how many different reasons can bring someone through the door?
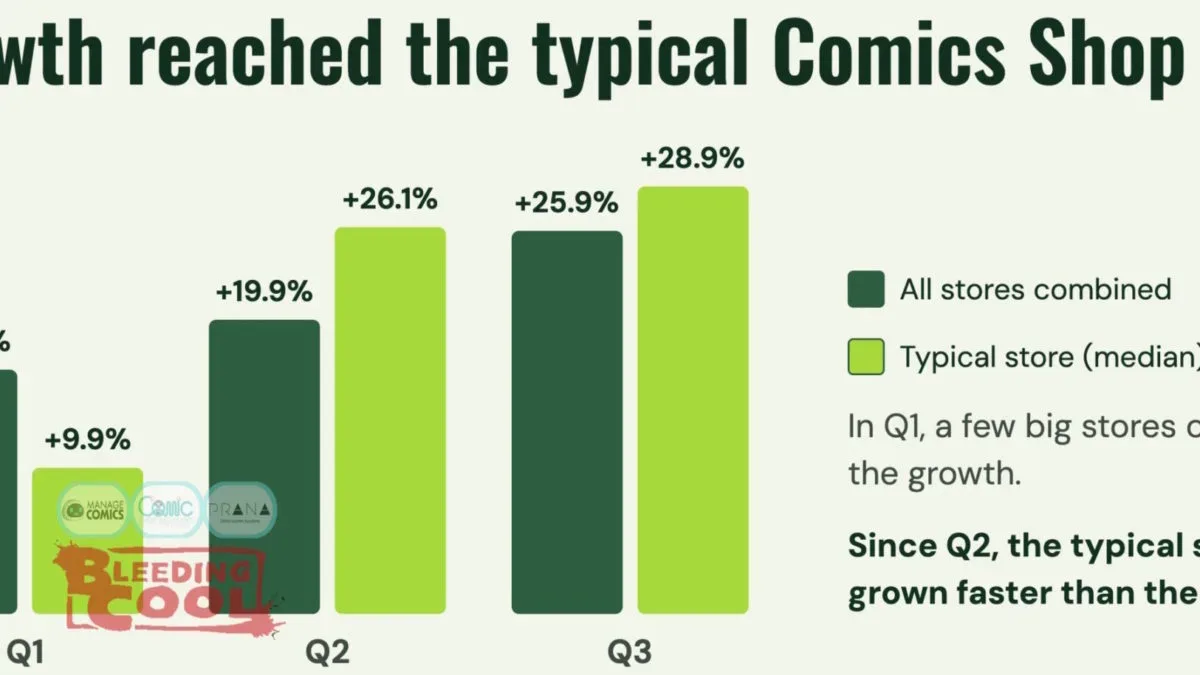
Across 82 comic stores with comparable prior-year data, same-store revenue in the third quarter of 2026 rose 25.9% versus Q3 2025. Register sales across that group reached $17.8 million. The gains were not solely the result of shoppers spending more per visit, either. Transaction counts increased 18.6%, while the average purchase rose 5.2%—the first increase in average transaction value reported for 2026.
That makes the quarter a notably broad piece of good news for a retail format that sells comics, yes, but also graphic novels, trading cards, games, toys, back issues, supplies and an impressive amount of things that become “just one more thing” at the checkout.
The figures were presented during Retailer Day at New York Comic Con 2026 by Atom Freeman, founder of Prana Direct Market Solutions. The data is significant because it measures cash-register activity rather than attempting to infer demand from one publisher, one distributor, or a narrow product chart. It is still not a census of every comic store, and it should not be treated as one. But the comparable-store methodology makes the year-over-year result more meaningful than a raw total that could rise merely because additional retailers joined the system.
A strong year, with a larger comparable sample each quarter
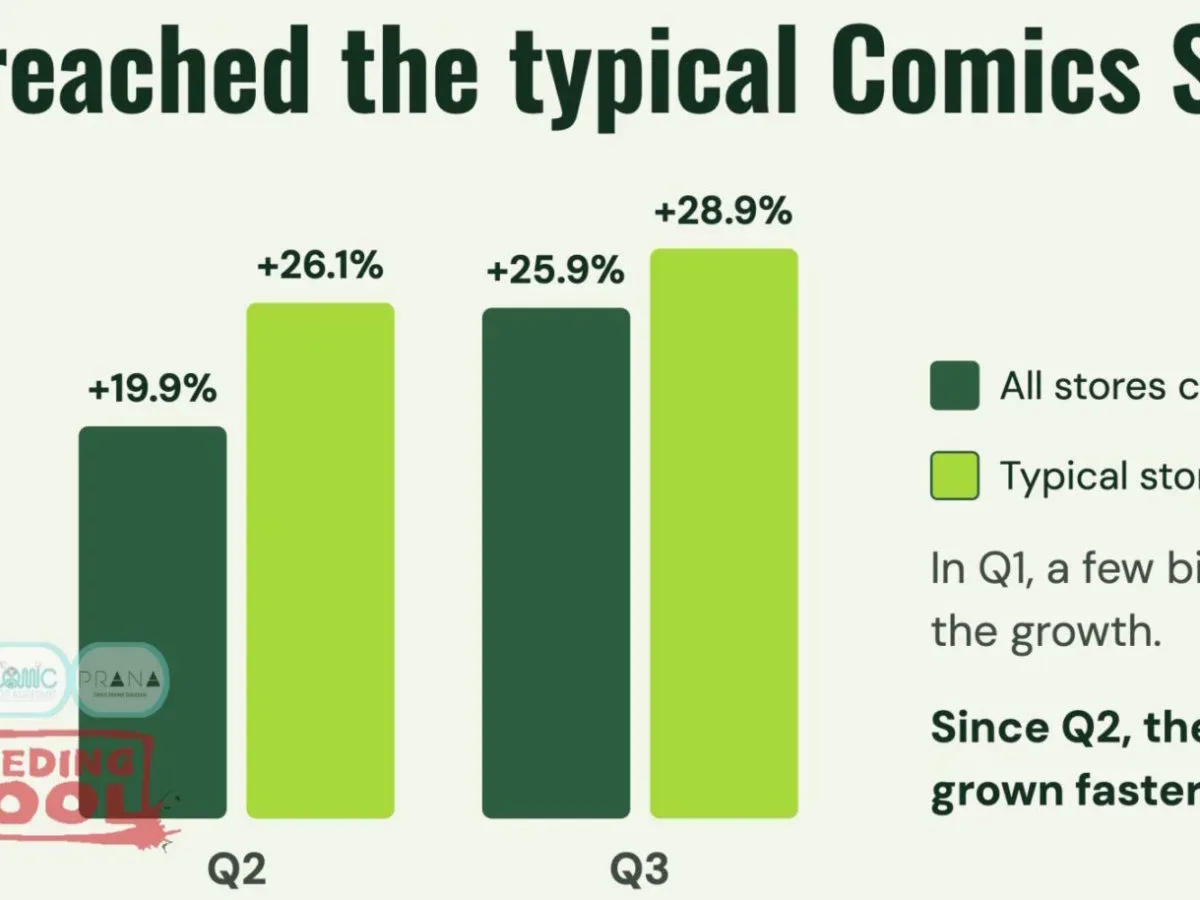
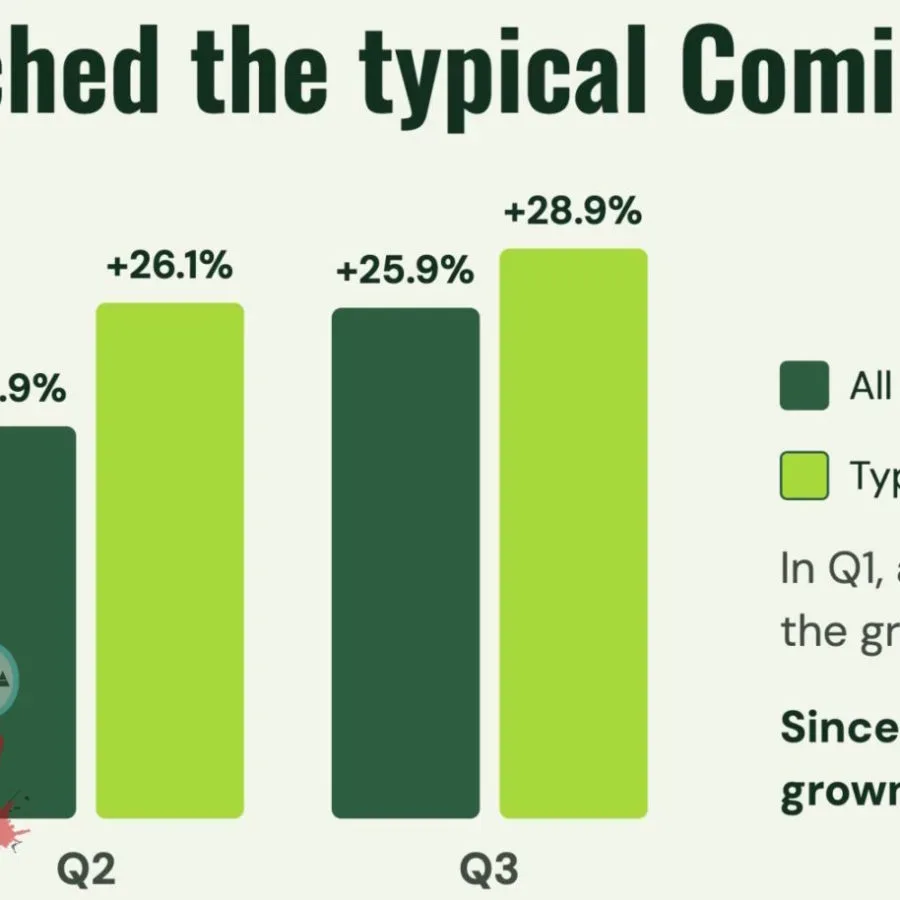
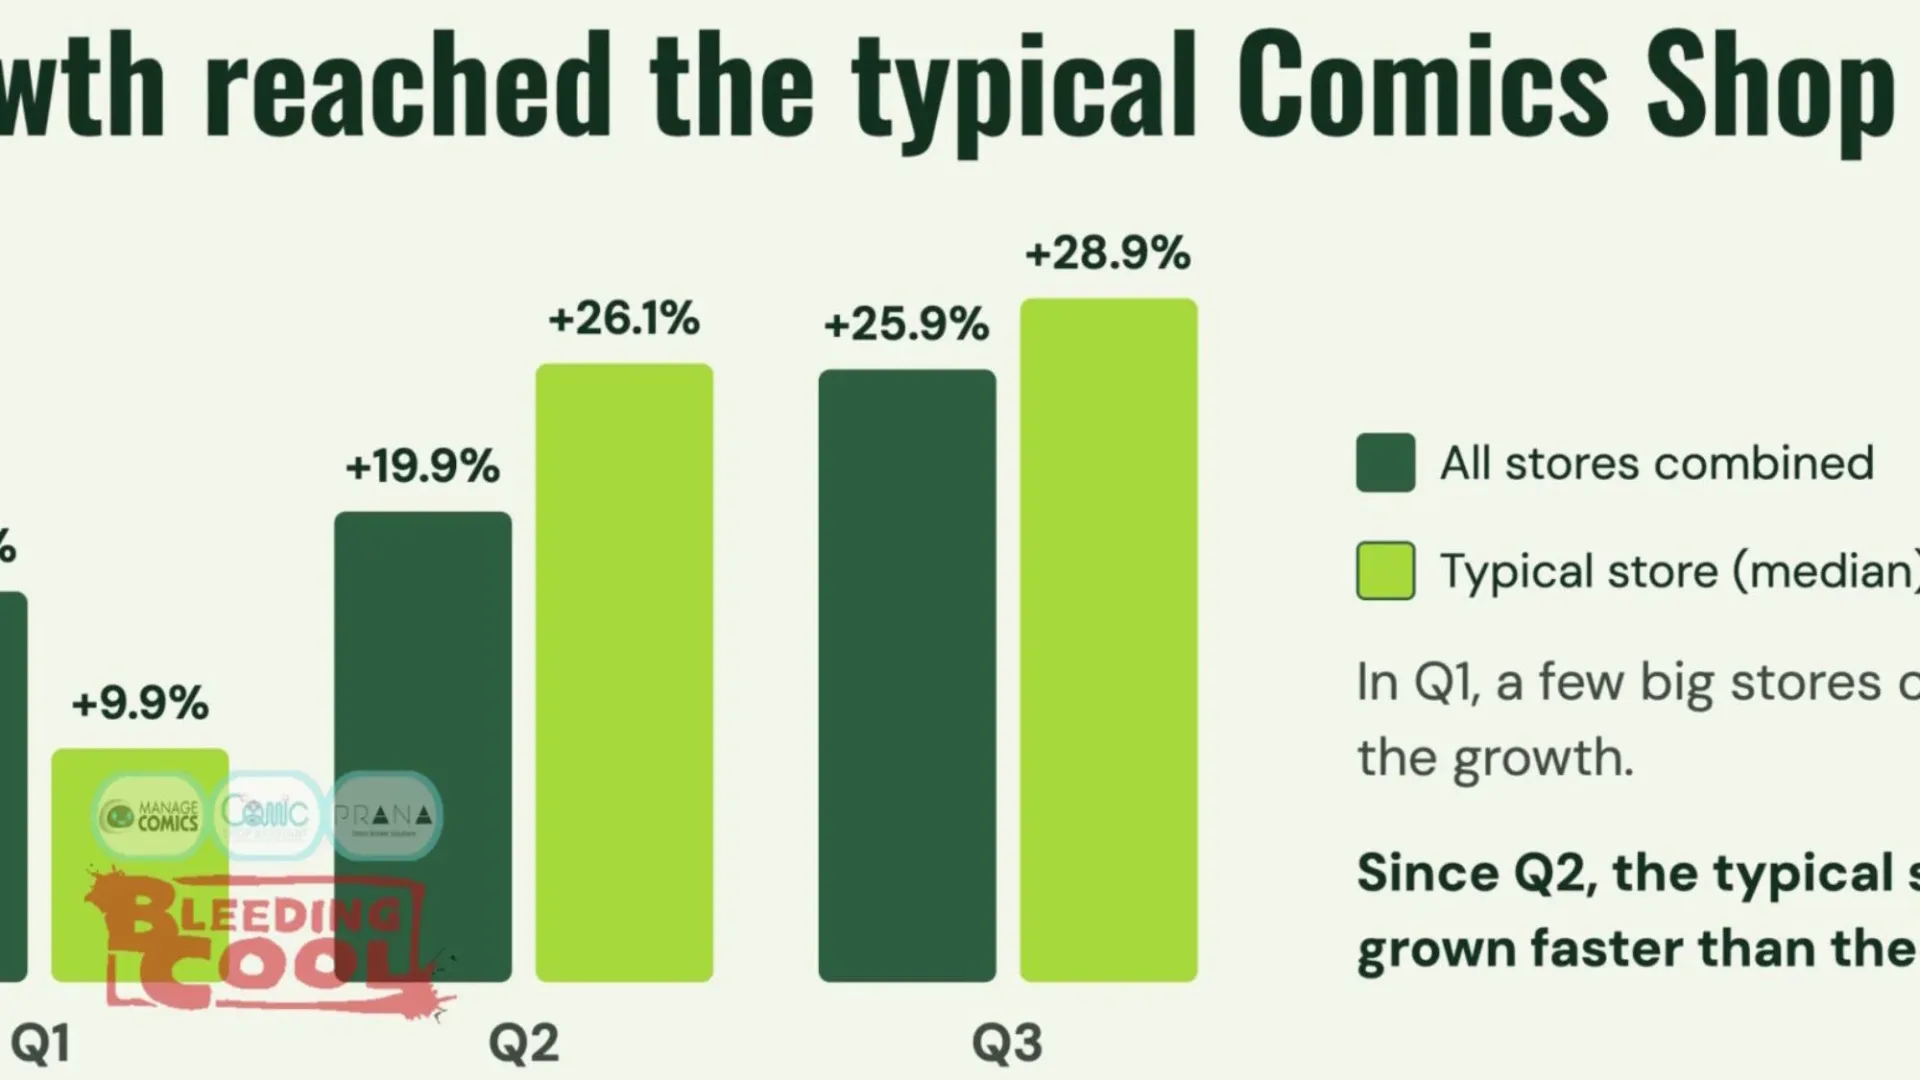
The Q3 number follows earlier gains of 16.5% in Q1 and 19.9% in Q2. The eligible sample also expanded as more businesses accumulated enough history for a like-for-like comparison: 40 shops were included in the Q1 year-over-year reading, 68 in Q2, and 82 in Q3.
Same-store sales is retail shorthand for comparing locations that were active in both periods being measured. It is designed to answer whether established stores sold more than they did a year earlier, rather than giving credit to a network simply for adding stores. In this case, a shop needed a full prior-year quarter in the system to qualify. More than 100 stores are now on the platform, which could support a broader comparable set in future reports.
There is another encouraging wrinkle in the pattern. Early in 2026, the biggest gains were concentrated among a relatively small number of larger stores. By Q2, the median shop—the middle performer when stores are ranked—had moved ahead in the reporting. That distinction matters. A headline increase powered only by a few large retailers can tell a very different story from one in which the typical shop is also growing.
It does not mean every shop is having the same quarter, nor does it establish why individual stores are up or down. Local markets, space, product mix and customer habits vary enormously. It does suggest, however, that the growth was not confined to the largest operations by the latter part of the reporting period.
Trading cards supplied the biggest chunk of new dollars
Trading cards and collectible card games accounted for 36% of the dollar growth in Q3 compared with the same period a year earlier. Books and graphic novels followed at 22%, while periodical comics produced 13% of the growth.
That split needs a little unpacking. “Share of dollar growth” does not mean cards represented 36% of all sales. It means that when the quarter’s additional revenue is compared with Q3 2025, cards and collectible card games made up more than a third of the increase. The category was the largest engine of incremental sales, not necessarily the largest department on the floor.
Periodical comics remained the largest product family, despite their share of Q3 sales falling from 30.3% to 26.7%. That change is best read as a sign that other categories grew faster, not as proof that comic issues stopped mattering. The presentation noted that comics grew between 9% and 11% in every quarter of the year. For retailers, recurring issue customers and their pullboxes are still a major foundation rather than a dusty piece of retail archaeology.
A pullbox, sometimes called a pull list, is a retailer’s reservation system for customers who want particular continuing comic series set aside. It helps shoppers reliably receive issues and gives stores a clearer read on regular demand. In an industry where customers may care deeply about getting a specific issue on release, it is both a service and an operational tool.
Other Q3 contributors also moved forward: games accounted for 9% of dollar growth; back issues, 8%; collectibles and toys, 7%; other products, 4%; and supplies, 2%. Accessories contributed less than 1%.
The practical picture is a store category increasingly driven by a mix of repeat comics business and complementary departments. A customer might visit for new releases, pick up a graphic novel, browse an older issue, and decide a pack of cards is an emotionally responsible purchase. The point-of-sale system sees only the basket. Retailers see the delicate economic ballet of getting the basket to exist in the first place.
Books look like an opening for more than the biggest shops
The clearest distinction in the Q3 data concerns which kinds of products favoured different store sizes. Larger retailers tended to pull ahead in areas where buying power and allocations can be decisive: trading cards, collectible card games, collectibles, toys and games. The presentation linked that edge to products whose supply, purchasing capacity or allocation can matter.
Allocation refers to the quantity of a sought-after product a seller receives when available stock is limited. It can be especially relevant in card and collectible markets, where a retailer’s capacity to order and secure inventory may shape what reaches shelves. Larger stores may have advantages in that environment, though the data does not establish that size alone determines results.
By contrast, the typical store kept pace with or outperformed larger stores in broadly available categories such as back issues, comics and graphic novels. Books and graphic novels stood out especially strongly: the typical shop grew that category by nearly 40% in Q3, and every shop in the set carried it.
That is a meaningful practical signal, even without reducing it to a one-size-fits-all merchandising commandment. Graphic novels can be easier to recommend to a newcomer than the 47th issue of a long-running series, and books give a shop a format suited to browsing, gifting and readers who prefer a complete or self-contained volume. The reported figures do not reveal which titles drove that result, how much shelf space each store used, or what individual customers bought. They do show that this was not just a niche performance at a handful of stores.
For physical collectors, the category mix also offers a useful reminder: a comic shop is not necessarily organized around a single kind of fandom purchase anymore. The same retail space may serve readers seeking a new graphic novel, collectors looking for back issues, card players chasing product, and customers interested in toys or games. That variety is part of the commercial story, not just décor around the long boxes.
Wednesday still owns the calendar, but Friday is gaining fast
Weekly sales patterns reinforce the importance of release schedules while showing room for a broader retail rhythm. Wednesday generated the largest share of Q3 revenue at 21.7%. Saturday followed at 20.5%, while Friday took 18.1%. Sunday accounted for 12.4%, Thursday 11.7%, Monday 8.0% and Tuesday 7.7%.
But Friday was the fastest-growing day year over year, climbing 30.9%. Monday increased 27.0%, Wednesday 26.9%, Tuesday 24.8%, Sunday 23.6%, Saturday 20.3% and Thursday 19.3%.
Wednesday’s lead is unsurprising in a business still anchored by new comic releases. Yet the Friday number suggests that shoppers are also showing up just before the weekend in increasing numbers. It could be a useful planning consideration for stores deciding when to schedule staff, refresh displays, run events or emphasize products that reward casual browsing. The report does not assign a cause to Friday’s growth, so it would be premature to claim a single explanation. Still, the combination of Wednesday’s scale and Friday’s momentum is hard to ignore.
That timing also fits the broader event-driven nature of the hobby business. A major convention’s retailer programming can turn attention toward shop operations, while fan gatherings remain a major part of the entertainment calendar; large fan events continue to make announcements and audience enthusiasm part of the retail conversation. The Q3 figures themselves, however, are retail data—not evidence that any one event or release caused the gains.
What the numbers do—and do not—say
The presentation’s operating takeaways were direct: maintain room for books and graphic novels, treat cards as a real strategy rather than a side department, protect pullbox customers, and plan around Wednesday and Friday. Each recommendation follows the product and day-of-week results, but their application will differ store by store.
- Books and graphic novels: nearly 40% growth at the typical shop in Q3 makes the category difficult to dismiss as an afterthought.
- Cards: they generated more than a third of new Q3 dollars, although the strongest gains were concentrated at larger retailers.
- Pullboxes and periodicals: comics remained the largest product family and showed steady quarterly growth, even as other departments expanded faster.
- Wednesday and Friday: the former brought the most revenue share, while the latter delivered the quickest year-over-year advance.
There are limits worth keeping in view. The results cover the tracked comparable stores, not every comic retailer. They measure sales revenue, not profitability, customer satisfaction, inventory risk or long-term sustainability. A sales increase is welcome, but it does not automatically reveal margins, staffing pressures, rent burdens or the cost of acquiring scarce inventory. The results also cannot prove that a category’s growth at one store will transfer neatly to another.
Still, the data offers a more textured image than the old caricature of the comic shop as a business surviving on Wednesday alone. Periodical comics remain central. Graphic novels appear to be a strong opportunity across store sizes. Cards are increasingly consequential, particularly for major retailers able to compete for supply. And Friday has become a growth day worthy of attention.
For an industry accustomed to reducing the conversation to whether comics themselves are winning or losing, the Q3 results suggest the shop is doing something more complicated—and, in this quarter, more lucrative. It is selling a connected hobby ecosystem, one pull list, paperback, booster pack and improbable checkout add-on at a time.