

A speedy external SSD should make moving game captures, installing a library, or copying a backup feel dramatically less painful. Yet a drive advertised with rapid transfer rates can still perform like it has decided to take a coffee break. The usual culprit is not necessarily the drive. USB performance is a chain: the computer’s port, the cable, any hub in between, and the storage device must all support the desired connection speed.
That makes testing worthwhile. A benchmark cannot turn a slower port into a faster one, but it can show whether an expensive drive, dock, or cable is operating in the neighborhood it should. It can also stop players and PC users from blaming the wrong component when large transfers drag on.
The first rule of this tiny detective story is simple: test the whole connection, then isolate the variables. A storage benchmark measures the drive’s transfers, but those transfers travel through the USB connection. With suitably capable hardware, the result becomes a useful indication of whether that connection is behaving as expected.
Start with a drive that will not hold the test back
For Windows, CrystalDiskMark is a commonly used open-source storage benchmark. On macOS, AmorphousDiskMark serves the same general purpose. Connect an external storage device, launch the appropriate app, choose that device from its drop-down menu, and run the sequential read-and-write test using the first button beneath All.
Sequential testing means working with data in a continuous run rather than scattered pieces. It is a sensible starting point for judging the connection because it gives a broad view of sustained transfer throughput. The result is not a magical, universal score for every file copy a person will ever make. Rather, it is a practical reading to compare with the capability of the port, cable, drive, or hub being examined.
The quality of the test device matters. Use a drive and cable rated to meet or exceed the speed of the port being tested. If the device itself cannot go fast enough, its result tells you about its own ceiling—not the port’s ceiling. A USB 2.0 device plugged into a USB4 port will still be limited to the USB 2.0 device’s maximum supported connection speed, even though the newer port is backwards compatible.
It is also wise to avoid relying on a thumb drive for this sort of diagnosis. Its performance can degrade more rapidly under intensive testing, making the result a poor foundation for judging the port. The goal is not to award a trophy to whichever accessory survives the ordeal; it is to make sure the storage device is not the bottleneck before drawing conclusions about the USB connection.
A straightforward test routine
- Check the computer manual to identify the port you intend to test and its claimed USB support.
- Use a storage drive and cable whose capability matches or exceeds that port’s expected speed.
- Connect the drive directly to the port first, rather than through a hub or dock.
- Select the external drive in CrystalDiskMark on Windows or AmorphousDiskMark on macOS.
- Run the sequential read-and-write benchmark.
- Compare the reported transfer figures with the connection’s expected class, while remembering that real transfers rarely equal the specification’s theoretical maximum.
- If the direct connection is satisfactory, add a hub or dock and repeat the process to see whether that extra link changes the outcome.
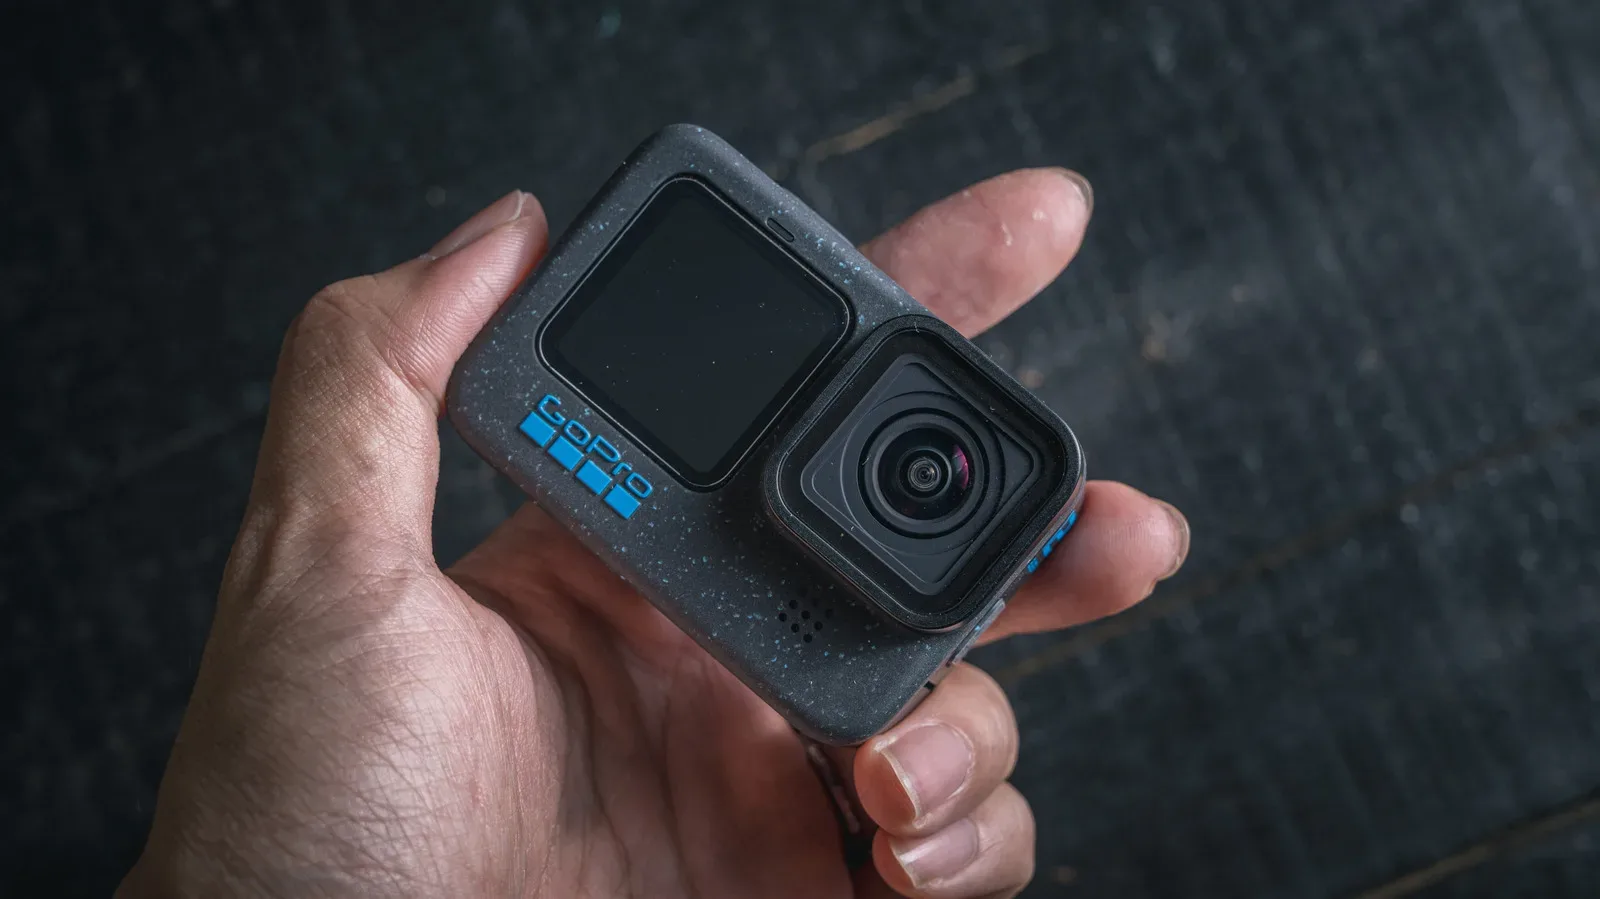
This process is especially useful for people shuffling large video files, screenshots, recordings, installers, or game backups. If an older action camera is being repurposed for another job, such as the projects discussed in this guide to reusing an old GoPro, knowing where a slower USB path sits can also make media transfers less mysterious.
Related coverage includes How to Test USB Port and Cable Speeds Properly.
Do not let a hub hide the real bottleneck
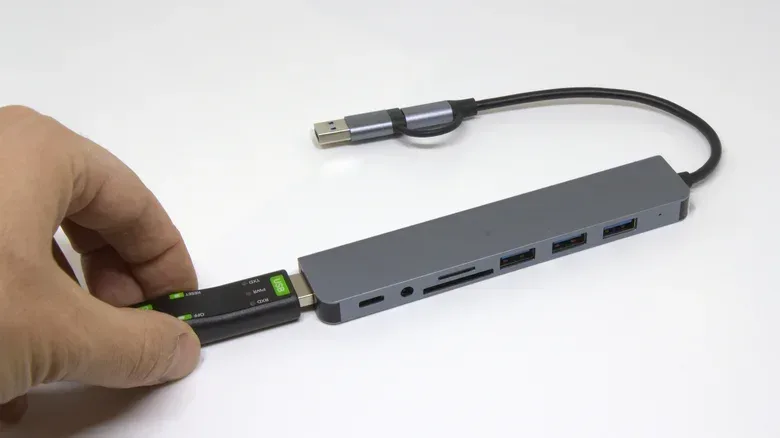
USB hubs are convenient, but convenience comes with another possible constraint. When evaluating a hub, attach the hub to the fastest available USB port on the host computer. That removes the computer-side connection as an obvious limiting factor and gives the hub a fairer test.
Then test the storage device through the hub. If the direct connection was strong but the hub result is substantially lower, the hub or its cable has become the key suspect. If both results are lower than expected, the host port, cable, storage device, or a mismatch between them may be responsible. This is analysis, not proof of a particular defective part: a benchmark demonstrates the observed transfer behavior, but it does not independently certify every item in the chain.
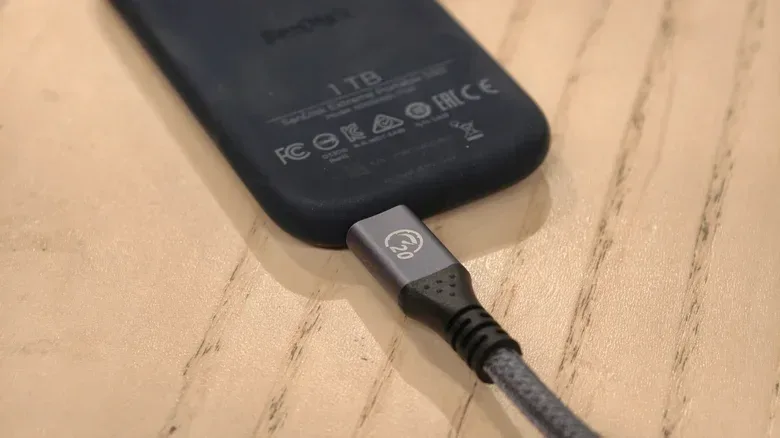
A cable deserves the same scrutiny as the devices at both ends. USB-C describes the physical connector shape; it does not promise a particular transfer rate. Two cables may fit the exact same USB-C ports while supporting very different data capabilities. Likewise, a computer can have several USB-C sockets that look interchangeable but do not offer identical USB versions or speeds.
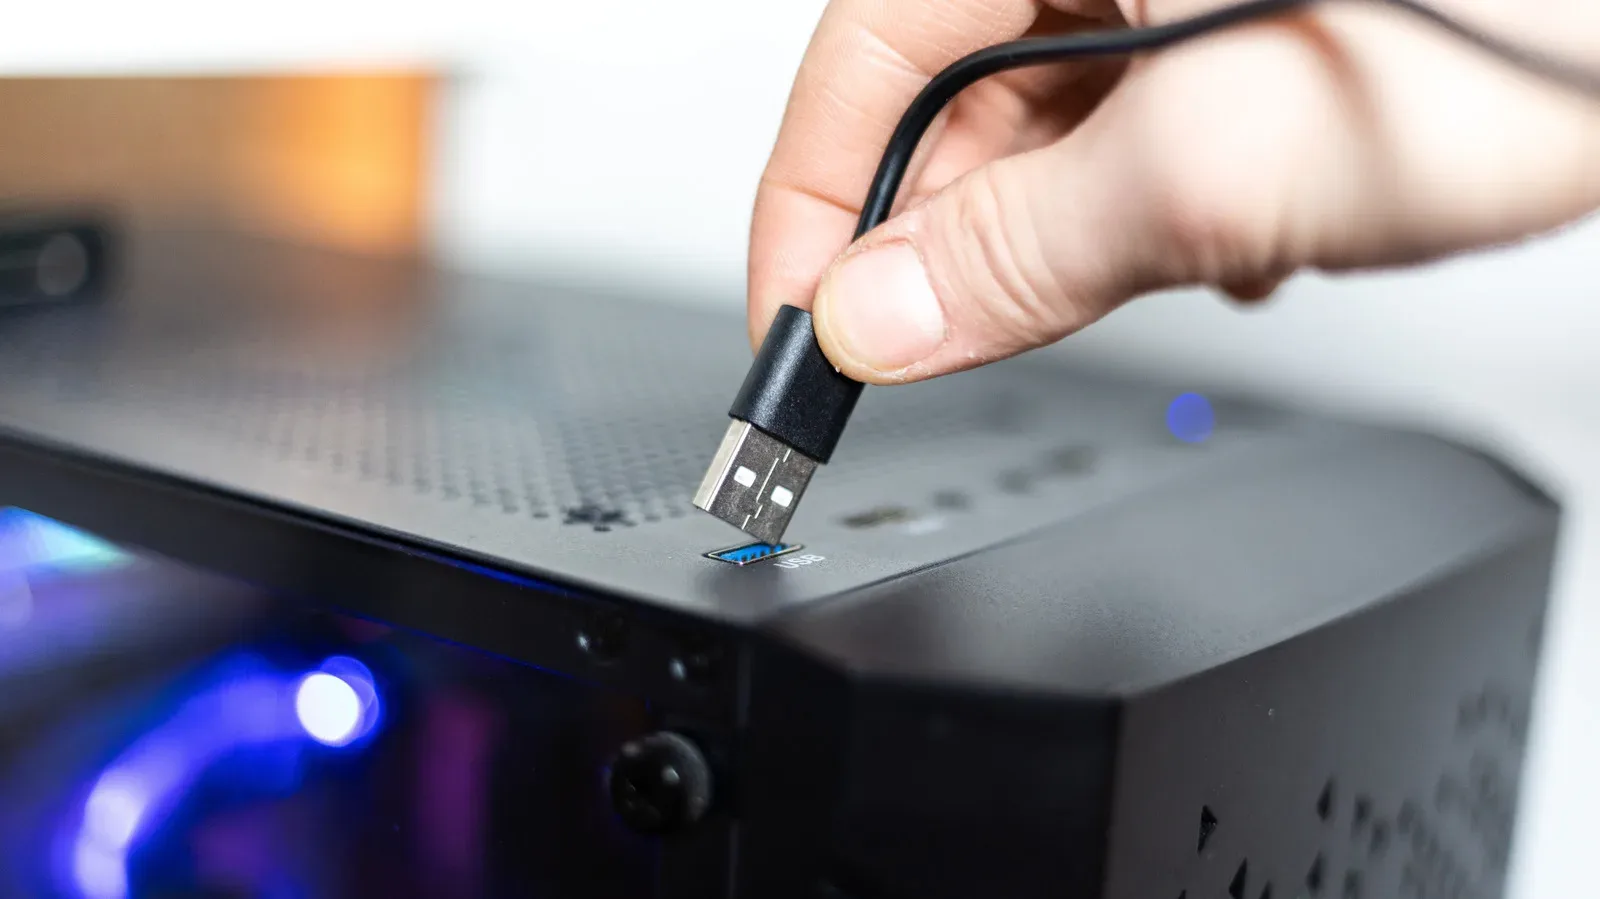
Colored plastic inside a USB port can offer a clue on some hardware, but it is not a universal speed legend. Treat color as decoration until the manual says otherwise. The reliable route is to consult documentation for the computer or motherboard, then confirm the live connection where possible.
USBView gives Windows users a second clue
Windows users can inspect the reported bus speed with USBView, a utility available through the Windows SDK. After installing the SDK, navigate to Program Files (x86) > Windows Kits > 10 > Debuggers, choose the folder corresponding to the machine’s architecture, and open USBView.
Select the attached storage device in USBView’s left pane. Under Device Information, find Device Bus Speed. The label may be more descriptive than the version numbers used in product listings. For example, a connection can appear as SuperSpeed 20 rather than “USB 3.2 Gen 2x2.”
USBView is valuable because it answers a question the benchmark alone cannot answer as directly: what speed class is the connected device actually using? The benchmark provides transfer measurements; USBView identifies the reported bus-speed category. Together, they offer a much clearer picture. A connection reported at a lower class than expected points to a compatibility or cabling limitation before anyone starts obsessing over minor benchmark variation.
Read the numbers without falling into the bits-and-bytes trap
USB specifications are generally expressed in bits per second. Storage tools commonly display bytes per second. One byte equals eight bits, so the units cannot be compared one-for-one.
For example, a benchmark reading in gigabytes per second needs to be multiplied by eight to express the rough equivalent in gigabits per second. That conversion is useful when comparing the result to a USB label such as 5 Gbps or 10 Gbps. Skipping it can make healthy performance look suspiciously slow, or make a modest result seem more impressive than it is.
Even after converting the units, do not demand an exact match to the standard’s headline number. Those published USB figures are maximum theoretical transfer rates. Real data transfers generally fall below them. The more useful expectation is that a higher class should clear the previous class’s threshold when the connected components all support it. A USB 3.2 Gen 2 device, rated at 10 Gbps, may not reach 10 Gbps in a test, but it should outperform the 5 Gbps level associated with USB 3.2 Gen 1.
The USB naming cheat sheet
USB branding has acquired enough renamed generations and similar-looking labels to make a game inventory menu seem restful. The following mapping helps translate the common labels used by documentation and USBView.
- USB 2.0 / Hi-Speed: 480 Mbps. This remains a baseline for many modern lower-spec devices.
- USB 3.2 Gen 1 / SuperSpeed: 5 Gbps. This category was previously marketed under some USB 3.0 labels.
- USB 3.2 Gen 2 / SuperSpeed+: 10 Gbps. It was also associated with earlier USB 3.1 branding.
- USB 3.2 Gen 2x2 / SuperSpeed 20: 20 Gbps.
- USB4: 20 Gbps, 40 Gbps, or 80 Gbps. The 80 Gbps tier is technically part of USB4 version 2.
The connector restrictions are important. USB 3.2 Gen 2x2 and USB4 are Type-C only. USB 2.0, USB 3.2 Gen 1, and USB 3.2 Gen 2 can use either Type-A or Type-C. A Type-C plug therefore narrows down neither the standard nor the speed on its own; it establishes the connector style, nothing more.
There is a further wrinkle for USB 3.2 Gen 2x2. USB4 host devices are not required to support its 20 Gbps mode. Some hosts do, but a Gen 2x2 connection can otherwise fall back to USB 3.2 Gen 2 at 10 Gbps. That means a “20 Gbps” device and a USB4 port do not automatically create a 20 Gbps connection. Verify the host’s support and inspect the reported bus speed instead of trusting an assumption based on the shape of the port.
Where Thunderbolt fits into the picture
Thunderbolt also uses the USB-C connector, which makes cable shopping and port identification even more dependent on reading the actual specifications. Its headline transfer speeds align closely with USB4 tiers: Thunderbolt 3 and Thunderbolt 4 are rated for 40 Gbps, while Thunderbolt 5 can reach 80 Gbps in both directions.
Thunderbolt 5 also includes an on-demand Bandwidth Boost mode that can divide bandwidth as 40 Gbps in one direction and 120 Gbps in the other. That is a particular capability rather than a reason to assume any USB-C cable will deliver it. A cable must specifically support the Thunderbolt standard being used.
The practical takeaway is gloriously unglamorous: document the port, verify the cable, use a capable drive, and test the complete route. USB labels are not always friendly, but a sequential benchmark plus USBView on Windows can turn a vague “why is this slow?” into a specific, evidence-based answer.