
A PC can feel perfectly ordinary right up until it does not. A sudden drop in responsiveness, fans that seem far louder than usual, freezing during demanding work, or crashes can all prompt the same question: is the processor getting too hot?
The CPU, or central processing unit, handles a wide range of everyday computing work, including keeping browser tabs running, editing photos and playing games. Its temperature naturally moves up and down with that workload. A number on its own is therefore less useful than a pattern: what happens while the machine is idle, what happens once a game or editing application is open, and whether a high reading persists rather than briefly appearing during a demanding task.
Checking that pattern does not require paid software. Tools including HWiNFO, Core Temp and HWMonitor can display CPU temperature information in real time. They provide a practical starting point for distinguishing between a PC that is simply busy and one that may need attention.
Start with a temperature monitor
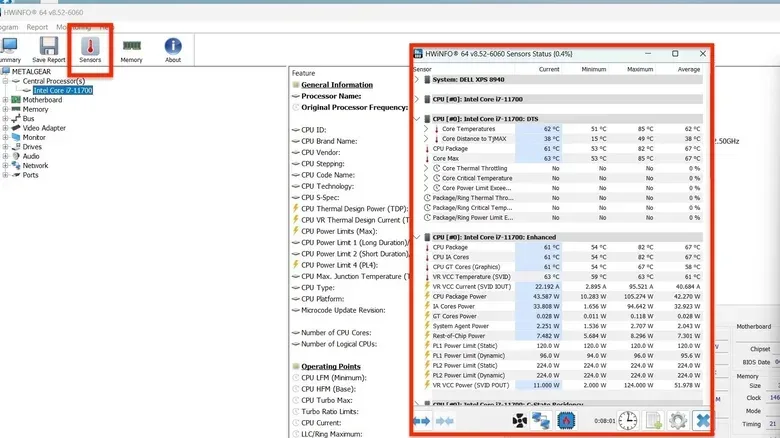
HWiNFO is a free diagnostic application that exposes a broad set of real-time hardware information for PCs and laptops. After installing and opening it, select the Sensors tab. That opens a separate window containing temperature readings for the CPU, shown in Celsius.
Core Temp and HWMonitor are alternative free applications that can provide comparable temperature information. The best choice is often the one whose display is easiest for you to check consistently. The important part is not collecting an enormous pile of numbers; it is observing the processor under meaningful conditions.
For a useful baseline, open the monitor when the system is doing very little, then check again while running something that places substantial demand on the CPU. A game, video-editing software or another resource-intensive program can make that comparison clear. A temperature rise when the workload increases is expected. The more relevant concern is a reading that remains elevated, keeps climbing, or is paired with performance issues.
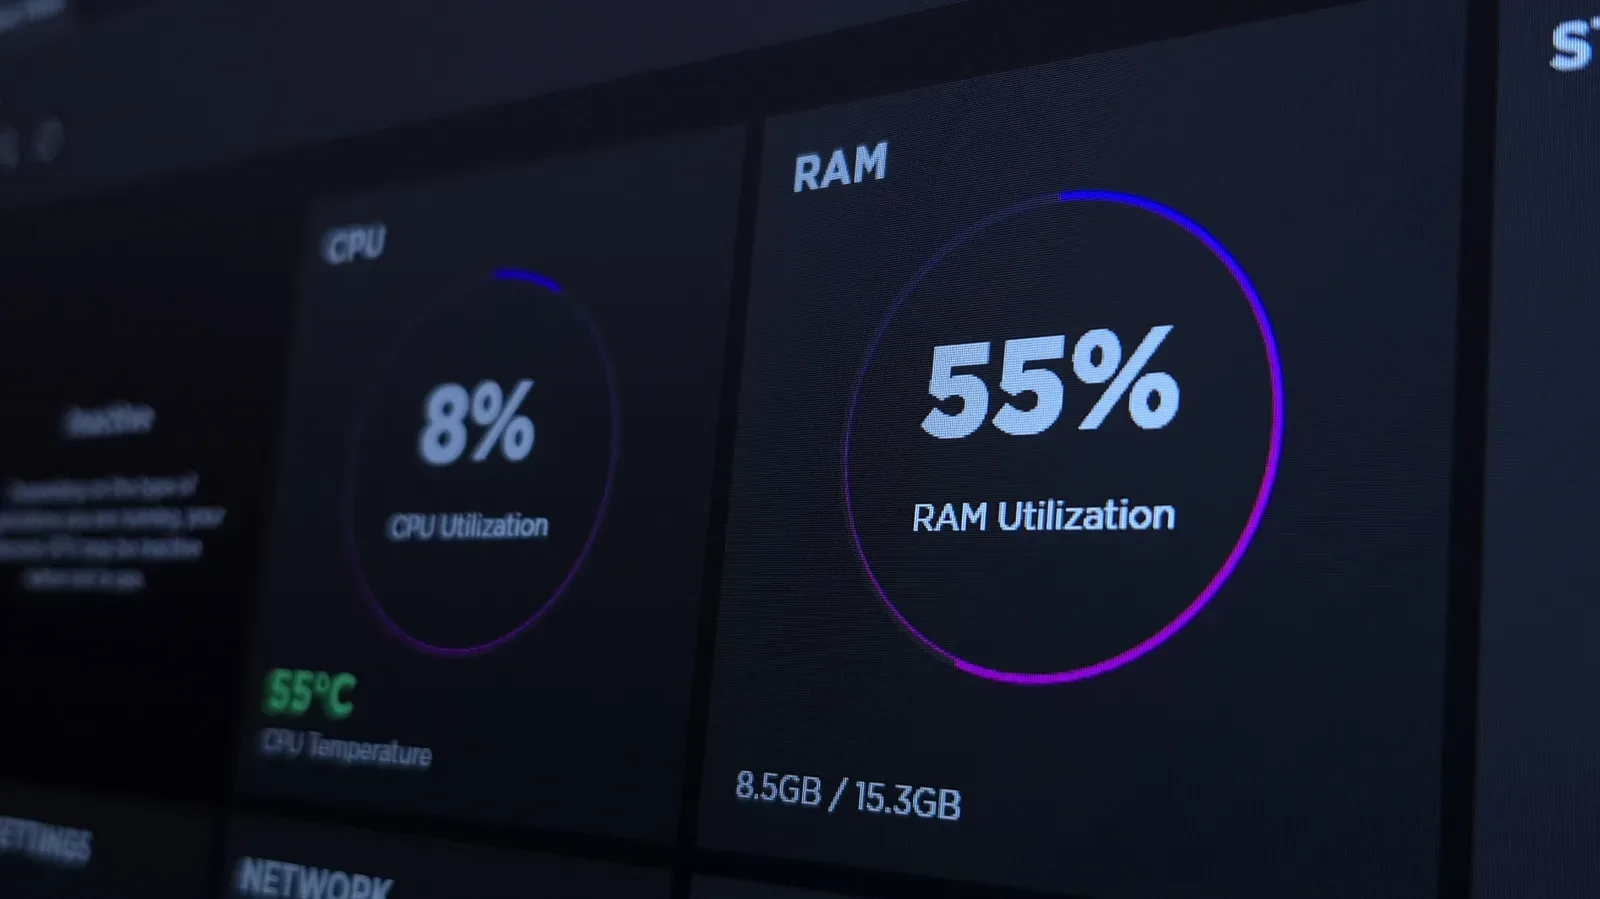
This is especially worthwhile for PC players. Games can make a system work much harder than an idle desktop, and fan noise may be one of the first changes a player notices. Temperature monitoring helps turn that vague signal into something measurable. It also pairs well with basic awareness of the rest of the system; for example, unusually high memory use can have its own explanation, as covered in this guide to why Windows 11 may appear to be using lots of RAM.
How to interpret CPU temperature readings
There is no single temperature target that applies identically to every processor. CPU models differ, and the manufacturer is the best place to check precise temperature ranges for a particular chip—particularly if you intend to overclock it. Overclocking means pushing a processor for higher performance, which makes model-specific limits especially important.
Related coverage includes How to Check Your PC CPU Temperature and Address Overheating.
Still, a few broad guideposts can help frame an initial check:
- An average running temperature of 60 degrees Celsius or lower is generally a solid everyday baseline.
- Consistent readings in the 70 to 90 degrees Celsius range warrant investigation, especially if they represent a new pattern or occur under workloads that previously caused no trouble.
- Temperatures reaching 90 degrees Celsius and above can indicate serious overheating. If the processor cannot cool down, sustained heat may reduce its lifespan.
Those ranges should be treated as guidelines, not as a verdict delivered by a single glance at a sensor window. A short increase while launching a demanding program is different from a processor that sits at an elevated temperature over time. Likewise, a high number matters more when it appears alongside the symptoms that led you to look in the first place: persistent loud fans, an unexpectedly sluggish system, freezes or crashes.
Thermal throttling explained
Modern CPUs include a protective behavior called thermal throttling. When the chip becomes too hot, it reduces performance in an attempt to lower its temperature. In everyday terms, that safety mechanism can make the computer substantially slower before a more severe failure occurs.
That explains why overheating does not always begin with an immediate shutdown. A game can feel less responsive, other work can take longer, and the whole PC can seem unusually bogged down because the processor is intentionally pulling back. If throttling cannot reduce the temperature sufficiently, freezing and crashing may follow.
Thermal throttling is a warning sign, not a fix. It protects the CPU by changing performance behavior, but it does not identify why the system is retaining too much heat. Monitoring helps establish whether that underlying issue is linked to software demand, airflow and dust, or the connection between the CPU and its cooler.
Compare idle and demanding workloads before changing anything
The most useful first step is to create a simple comparison rather than react to a single reading. Check the CPU temperature when the PC is relatively quiet. Then launch the game, editing program or other demanding workload that seems to bring out the problem and observe how the reading changes.
This comparison can clarify the scope of the issue. A temperature that rises under load is normal behavior. A temperature that remains consistently high, enters the 70-to-90-degree range for extended periods, or approaches and exceeds 90 degrees is the reason to look closer. If a game is the trigger, repeat the check during that game rather than relying on a desktop reading that does not represent how you actually use the machine.
It is also worth looking at the timing. If the PC suddenly feels slow, temperature data can help tell whether heat is plausibly part of the story. Conversely, if the CPU temperature is not unusually high, the cause of sluggishness may lie elsewhere. The point is not to diagnose every PC issue from one sensor, but to avoid guessing when a free measurement is available.
First response: reduce unnecessary CPU load
A hot processor may be working hard because a program is consuming a large share of its processing capacity. On Windows, open Task Manager and identify applications that could be taxing the CPU. Closing an unnecessary, resource-heavy program is a direct test: monitor the temperature afterward and see whether it falls.
This step is useful because it separates workload from maintenance. If closing a demanding application meaningfully reduces the temperature, the software load is contributing to the spike. If the temperature remains high after the load is removed, the PC may have a physical airflow or cooling issue instead.
Do not confuse a demanding application with a defective one purely because the CPU becomes warmer. Gaming, video editing and other resource-intensive tasks are exactly the situations in which temperatures should be compared with idle behavior. The concern is sustained heat that is outside the processor’s expected range, or temperatures paired with throttling, instability or other deteriorating performance.
Check airflow, fans and dust buildup
If trimming CPU-heavy software does not bring the temperature down, inspect the physical system—particularly on a desktop tower. Dust can accumulate in fans and on components, interfering with airflow through the case. That turns what might appear to be a software performance problem into a basic maintenance problem.
Open the tower and look for dust on the fans and components. Compressed air can be used to blow dust out and improve airflow. If the case has removable dust filters, take them out and clean them as well.
This is not merely about making the interior look tidier. The fans and case airflow are part of the CPU cooling system’s job. When the processor is under load, heat needs to move away from the chip and out through the system. Dust that compromises that airflow can make higher temperatures more likely and may cause fans to work harder, which is why a suddenly loud PC can be an important clue.
After cleaning, use the same kind of test that revealed the issue: monitor temperatures at idle and while running the relevant demanding program. A before-and-after comparison is more informative than assuming a cleanup solved the problem because the machine looks cleaner.
When thermal paste may be part of the problem
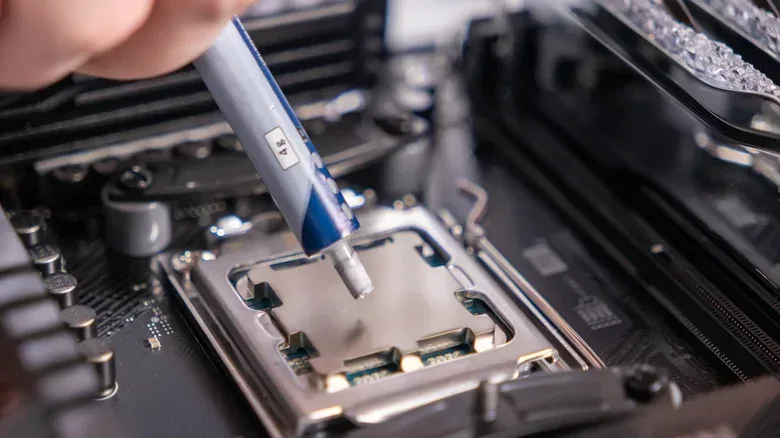
Another possible cause is aging thermal paste. Thermal paste is the thin material placed between the CPU and its heatsink. The heatsink is cooling hardware designed to draw heat away from the processor; the paste helps create the thermal connection that allows heat to dissipate effectively.
Over time, the paste can dry out. Reapplying it may help when CPU temperatures remain higher than normal and basic workload and dust checks have not resolved the issue. The process requires temporarily removing the CPU’s cooling hardware, so it is sensible to follow a detailed guide rather than treat it as a casual change.
For someone comfortable working inside a PC, this is a manageable maintenance task, but the cooler removal is the key practical consideration. The goal is not simply to add material; it is to restore the thin conductive layer between the processor and the heatsink so heat can move away from the chip as intended.
Why periodic checks are worth the effort
CPU temperature is only one measure of a PC’s overall condition, but it is a useful one because it connects directly to performance, noise and long-term component care. A quick sensor check every so often—at idle and during the tasks you actually run—can reveal a shift before it becomes a cycle of throttling, freezes and crashes.
That kind of routine is increasingly practical when replacing components can be costly. CPUs, alongside GPUs, RAM and storage, have been subject to rising prices, and both AMD and Intel increased CPU prices earlier this year, with further increases reportedly planned. Maintaining airflow, investigating abnormal heat and responding to a persistent temperature change can all help extend the useful life of an existing machine.
The sensible approach is measured rather than panicked: use a free monitor, compare quiet and demanding conditions, treat broad Celsius ranges as signals instead of absolute rules, check Task Manager for unnecessary CPU load, then inspect dust, filters and cooling hardware if the problem persists. For any effort to push a processor beyond normal operation through overclocking, consult the CPU manufacturer’s own temperature guidance.