
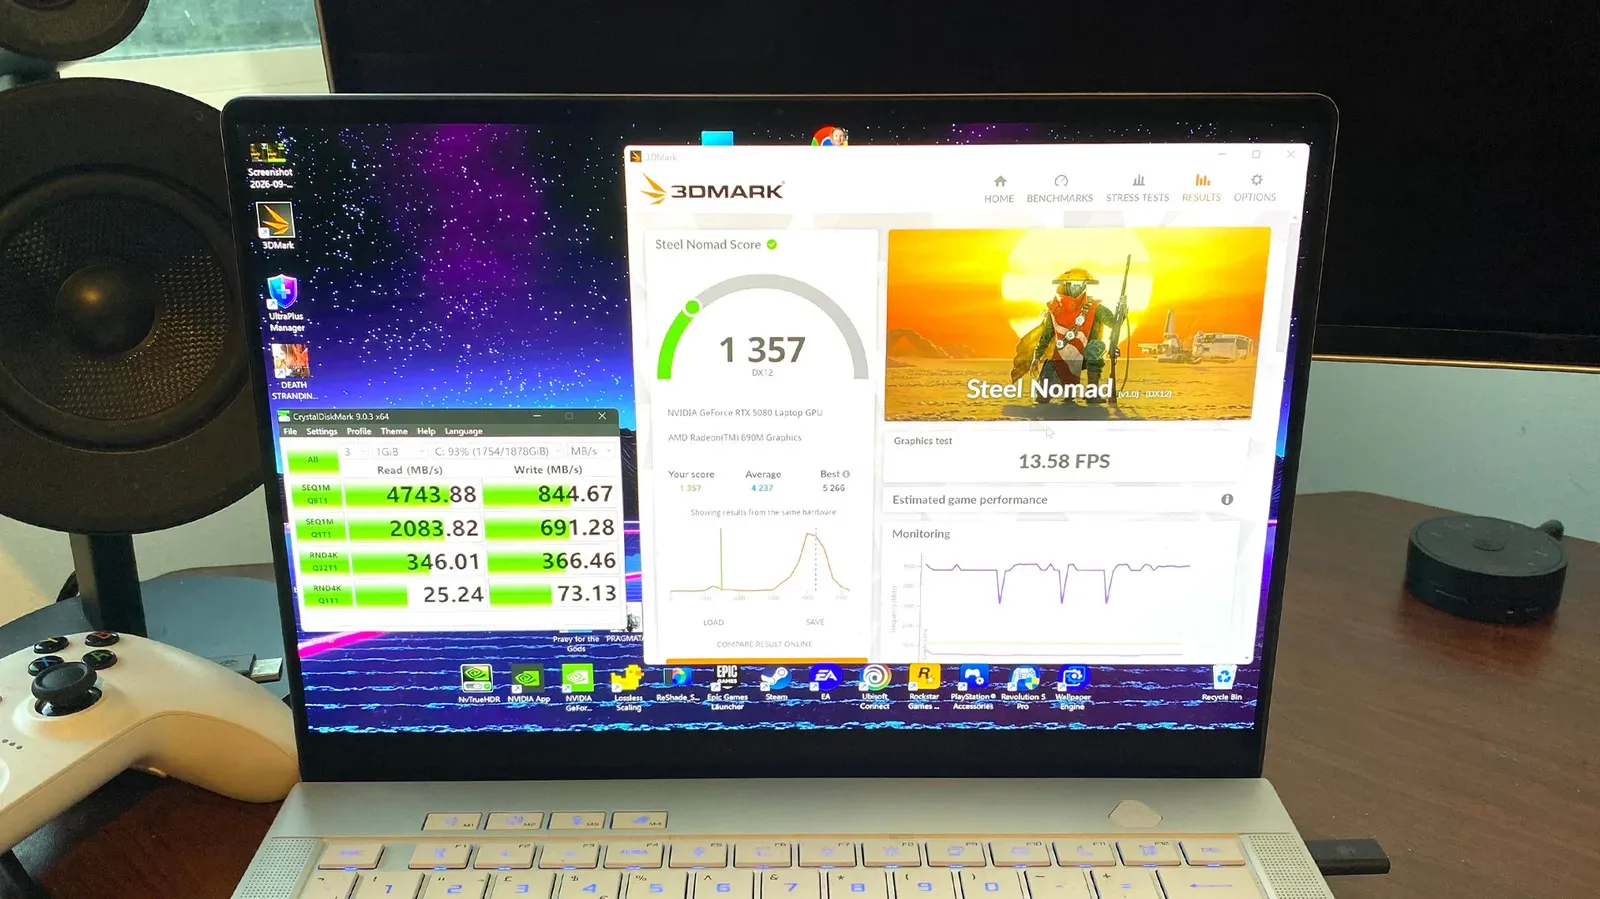
A benchmark is a repeatable workload designed to measure how a component performs. For a gaming PC, that makes it a useful reality check: rather than guessing whether a graphics card, processor or SSD is behaving as expected, a benchmark supplies a score, frame-rate data or transfer-speed result that can be compared over time or against similar hardware.
The key is not to treat one number as a universal verdict on a whole PC. Graphics cards, CPUs and storage drives do different jobs, so each needs a test that reflects that job. Four widely accessible tools cover the main bases: 3DMark and Superposition for GPU-focused testing, Cinebench for CPU rendering performance, and CrystalDiskMark for SSD read and write speeds. All have free options, making them practical starting points for someone diagnosing disappointing game performance or simply checking a new system.
For real games, built-in benchmarks remain especially valuable. Synthetic tests such as 3DMark establish a useful baseline and make hardware-to-hardware comparisons easier, but an in-game benchmark shows how a particular title and its settings perform on the PC in front of you. The sensible approach is to use both: establish component behaviour with dedicated tools, then use a game benchmark or frame-rate overlay to decide whether the experience is actually where you want it.
Start by deciding what you are measuring
A GPU, or graphics processing unit, renders the images seen in games. GPU benchmarks therefore lean on demanding visual workloads. A CPU, or central processing unit, handles a broader set of system and game tasks; CPU benchmark results here focus on rendering. An SSD is solid-state storage, and its benchmarks report how rapidly data can be read from or written to the drive.
That distinction matters when interpreting a poor result. A low SSD speed score is not the same problem as a disappointing graphics score. Likewise, a result that trails comparable systems does not automatically mean a component is defective. Windows power settings, background applications, available disk space and laptop power state can all affect a test. The first job of benchmarking is to narrow down where the discrepancy lives.
3DMark is the baseline GPU comparison tool
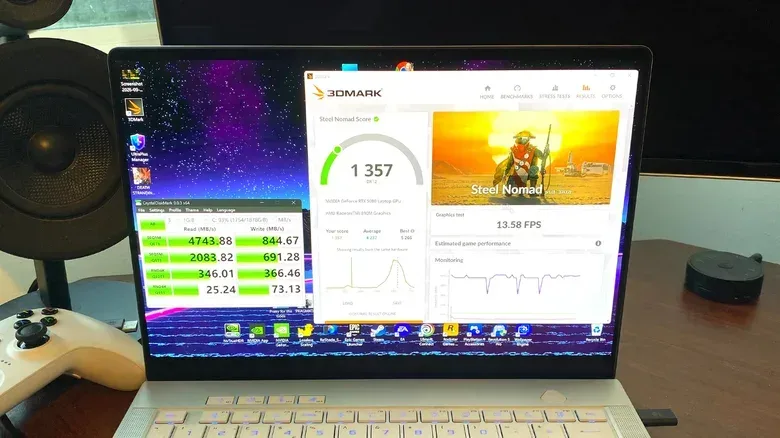
For graphics-card testing, 3DMark is particularly useful because its results can be compared with those from people using similar setups. Its free demo on Steam includes tests such as Solar Bay and Time Spy. That comparison element is the real advantage: a score means much more when it is assessed beside results from comparable hardware rather than viewed in isolation.
There is also a $30 premium version with extended stress tests. Those can be useful for people who specifically need that longer test, but they are not essential for a straightforward check of whether a typical PC is performing broadly as expected.
3DMark’s Speed Way test is a more strenuous option for the graphics card, using ray tracing and global illumination effects. Ray tracing is a rendering technique used to model light behaviour, while global illumination concerns how light contributes to a scene beyond a single directly lit surface. In plain terms, those effects make for a demanding graphics workload.
Related coverage includes Four Free PC Benchmarks to Check GPU, CPU and SSD Performance.
One useful combined check is to run Cinebench’s CPU multi-core test alongside 3DMark Speed Way. This puts the CPU and GPU under load at the same time, which more closely resembles a gaming scenario than testing only one component. It is also a scenario where temperature behaviour can become more revealing than it is during a very short test.
Superposition adds clocks and temperatures to the picture
Superposition is another GPU benchmark that uses the UNIGINE 2 Engine to simulate intensive lighting and visual effects. Alongside the workload itself, it can monitor graphics-card clock speeds and temperature. That makes it useful when the question is not merely “what score did this card get?” but “how is it behaving while working hard?”
Clock speed is the operating frequency of the GPU. Temperature readings and clock-speed behaviour together can help illustrate how the card’s cooling fans are coping under stress. Superposition has not had a major update for some time, but it remains a worthwhile additional option for a graphics-focused check.
Used alongside 3DMark, it can provide more than one view of GPU performance. That does not mean a pair of synthetic benchmarks replaces game testing. It means there is more evidence to consider before deciding whether disappointing performance comes from the graphics card, a system setting, cooling, or the requirements of the game being played.
Cinebench puts the processor under a rendering workload
Cinebench is the CPU-focused pick for rendering performance and is a reliable way to stress-test a processor. Its CPU multi-core test matters because modern CPUs have multiple processing cores, and this test assesses the processor while those cores are working together on the rendering task.
For gaming, CPU results should not be read as a direct promise of a certain frame rate in every game. Instead, they are a component-level indication of how the processor is performing in the workload being measured. The more useful diagnostic question is whether the result looks consistent with the rest of a PC’s configuration and whether performance changes as the test continues.
If rendering performance repeatedly dips over the course of a Cinebench run, thermal throttling may be involved. Thermal throttling is when heat causes hardware to reduce performance. That makes longer, sustained work valuable: a PC can appear fine at the beginning of a demanding task but struggle once temperatures rise.
Cooling is not a cosmetic concern in this context. Regulating the temperatures of core components is important to maintaining performance. If heat is a recurring issue, liquid cooling may be worth considering, although a benchmark result alone is a signal to investigate rather than a complete diagnosis.
CrystalDiskMark checks whether storage is keeping pace
CrystalDiskMark is the free, open-source choice for testing SSD sequential read and write speeds. Sequential activity means data is read or written in an ordered sequence, and the tool provides a quick way to assess that aspect of drive performance.
Test preparation is especially important for storage. Close background applications before running CrystalDiskMark, leave at least 10% of the SSD free, and plug a laptop into its charger before benchmarking its drive. These are simple steps, but they help make the result a clearer measure of the drive instead of a snapshot distorted by unrelated activity or a laptop’s power state.
Slow CrystalDiskMark results can also be a clue when cooling is the concern. As with Cinebench, a disappointing result is not proof of one specific fault. It is a reason to check the broader system conditions, especially if the result remains slow after background activity has been removed and the drive has adequate free capacity.
In-game benchmarks answer the question players actually have
If a game includes a benchmark mode, it will normally provide the best indication of how that specific game will run on the system. This is where a player can assess straight frame-rate performance, often abbreviated as FPS, or frames per second.
Forza Horizon 6 offers a detailed example: its benchmark measures GPU performance and CPU utilisation, and presents maximum, minimum and average FPS graphs. Those three figures offer different perspectives. Maximum FPS reflects the highest observed rate, minimum FPS catches the low points, and average FPS gives an overall middle figure. Seeing all three is more informative than focusing solely on a best-case number.
Cyberpunk 2077 also includes a benchmark, using a crowded Night City scene. It can be used to adjust graphics settings and assess the impact of those changes while aiming for a steady frame rate. That is the practical strength of an in-game test: it is tied to the game, scene and settings a player intends to use.
Games without built-in benchmark modes are not a dead end. Nvidia and AMD applications can show an in-game FPS display. Steam also offers this option, as does Windows 11 through Xbox Game Bar. FRAPS remains a fallback for basic benchmarking, though it has not been updated since 2013 and does not provide particularly deep analysis.
Checking sustained performance rather than only a momentary FPS number is important. A game may look excellent during a brief quiet scene but become less consistent in a crowded or graphically intense moment. Built-in test scenes and performance graphs are helpful precisely because they make those fluctuations easier to see.
How to read a bad result without jumping to the wrong fix
A benchmark is best used as evidence, not a panic button. Regular Blue Screens of Death are a much clearer indication that something is wrong with a PC than a single odd benchmark result. Still, repeated results that are significantly below comparable systems can identify an issue worth investigating.
- Compare like with like. A 3DMark score becomes useful when checked against similar hardware configurations, not an unrelated high-end system.
- Repeat a surprising result. Consistency matters. One run can be affected by background activity or system conditions; a persistent shortfall is more meaningful.
- Check Windows power settings and background apps. Either can contribute to lower-than-expected results.
- Watch for performance dropping over time. A decline during sustained Cinebench work may point to thermal throttling.
- Do not ignore storage conditions. For CrystalDiskMark, clear background tasks, retain at least 10% free SSD space and connect a laptop to power.
- Use game benchmarks for game decisions. They are better suited than a general synthetic score to choosing settings for a particular title.
Not every disappointing result can be fixed with software settings. If gaming performance remains weak across tests, the graphics card may simply lack sufficient VRAM for the intended workload. VRAM is the graphics card’s video memory, used for graphics data. That is a hardware limitation rather than a result a benchmark can magically improve.
Benchmarking is therefore most useful when it leads to a specific next question. Is the GPU score unusually low for similar systems? Is the CPU losing speed under sustained heat? Is an SSD being tested while nearly full or while other applications are active? Or does an actual game benchmark show that lower graphics settings are needed for a steadier FPS target? Clear questions produce more useful results than endlessly chasing a single score.
For broader PC upkeep, network hardware can also affect the overall gaming setup even though it is outside the scope of these local component tests; our look at owning your network rather than renting an ISP router covers that separate side of the equation. Benchmarks will not solve every performance complaint, but these four tools give PC players a structured way to determine whether the graphics card, processor and storage are delivering what the hardware should.