

Comic-book sales charts have sparked a familiar kind of industry argument: not merely which book is winning, but whether anybody can reliably say who is winning at all.
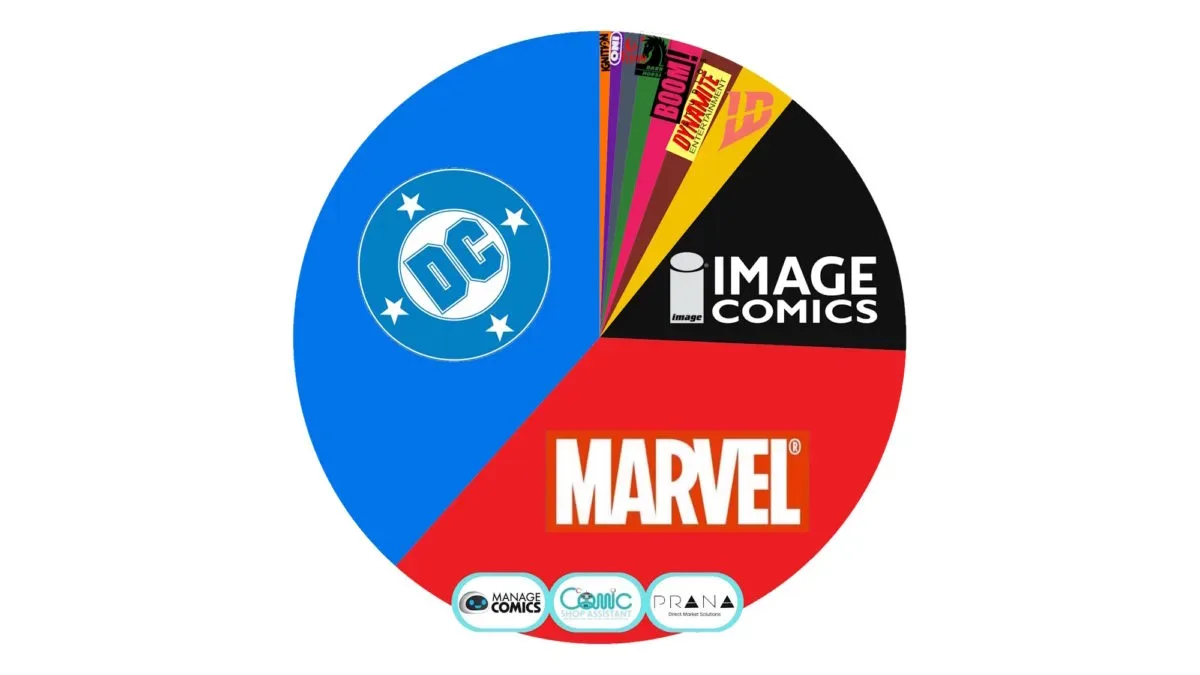
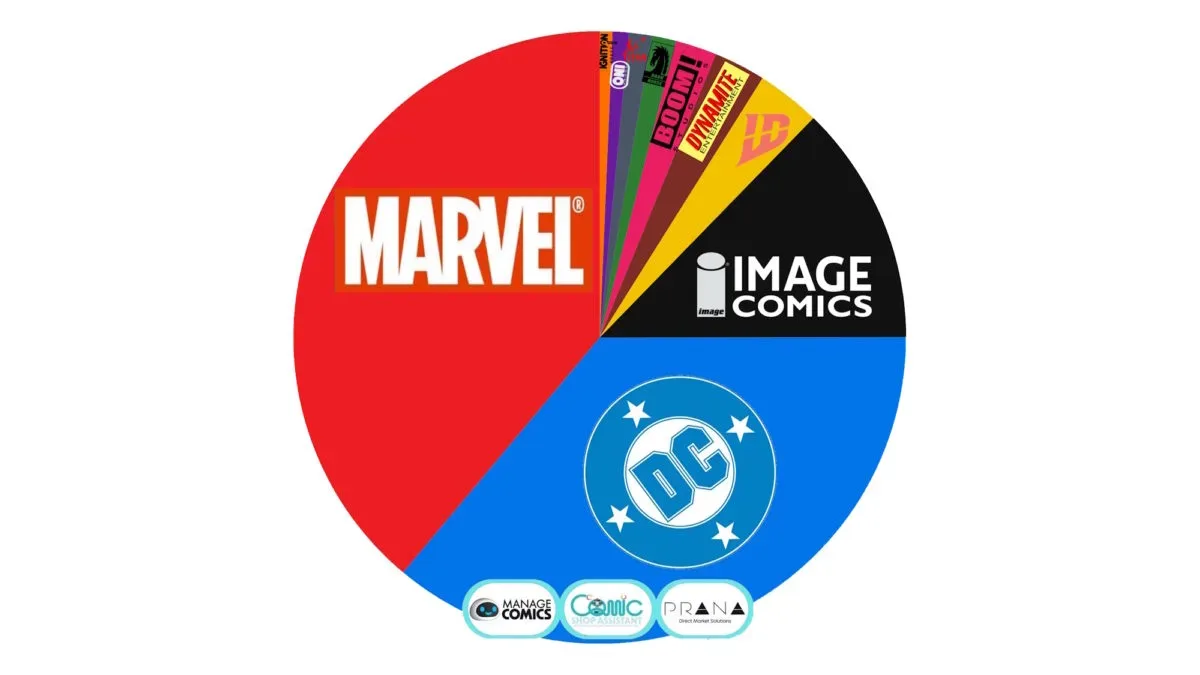
Rob Liefeld recently argued on social media that there are no official comprehensive comics sales charts, characterizing modern rankings as unreliable estimates assembled from only part of the retail market. Prana: Direct Market Solutions founder Atom Freeman responded that his company’s bestseller list is built from store data, including information supplied through Manage Comics, Comic Shop Assistant, and other retailers. Freeman says that system currently incorporates preorder and sales information from more than 600 stores and 80,000-plus consumers.
Both positions point to a real distinction that is easy to blur in a rankings debate. A chart can be useful without being official, and it can measure actual customer purchases without representing every sale in every channel. The friction comes when a partial but meaningful dataset is read as a final industry-wide scorecard—or when its limits are used to dismiss it altogether.
There is no single comprehensive comics scoreboard
Liefeld’s core point is straightforward: no publisher is providing a complete, unified public accounting of all comic-book sales. He said Image Comics publishes a top 10, but argued that the broader charts circulating online are not official publisher reports and do not cover the entire retailer base.
That absence matters. “Official” data generally suggests a complete report issued by a rights holder, publisher, distributor, or centralized market authority. The available comic-book data described here does not meet that standard. It is assembled from participating stores and platforms, while important sellers may not submit their numbers. Liefeld specifically noted that large retailers and chains do not share their data for these lists.
Even the older distribution-focused reporting did not provide a clean measure of readership. Diamond’s historical comparative charts tracked comic orders to stores rather than individual purchases by customers. That difference is fundamental. A retailer can order a book in anticipation of demand, then take weeks, months, or longer to sell those copies—or never sell all of them.
Those historical distributor figures also did not encompass bookstore, subscription, or digital transactions. So neither the old model nor the current one described by the participants offers a universal count of every comic sold everywhere.
Sell-through versus sell-in: the argument’s most important technical term
The crucial concept is sell-through. In this context, sell-through means a comic has been sold by a participating shop to a customer. That differs from sell-in, which means copies were sold into retail inventory—typically a publisher or distributor transaction with the shop.
They answer separate questions:
- Sell-in: What did retailers decide to order?
- Sell-through: What did customers actually buy during the measured period?
Liefeld’s criticism focuses on coverage. If the reporting pool excludes some major stores and chains, the rankings cannot be treated as a complete representation of the direct market. That is a fair limitation to keep in mind.
Freeman’s response focuses on what the participating data records. In his description, the Prana list contains preorder and sales data from its retail network, rather than guesses presented as raw nationwide totals. He also said Prana has not released estimated unit-sales figures. Any such estimate, he acknowledged, would be an extrapolation, even if based on shop-level sell-through.
That distinction is responsible methodology, at least as it is described: a ranking can show relative performance in a known sample without claiming to know the exact national total. A weekly top 400 derived from participating-store sales may be a valuable directional measure. It is not, by itself, proof that book No. 1 sold a known number of copies across every retailer and format.
Why variant and exclusive covers complicate order charts
The debate also touched on retailer-exclusive covers, which can distort interpretations of retailer ordering. A shop might bring in a large quantity of an exclusive variant, but those copies may move to customers gradually over a long span. An order-based chart can register the full inventory intake immediately, while a sell-through chart captures purchases only as they happen.
Neither view is inherently false. They simply describe different moments in a comic’s commercial life.
An order spike can demonstrate retailer confidence, promotional activity, collector demand, or a store’s strategy around a particular cover. Sell-through can demonstrate customer transactions within the shops represented in a dataset and during the selected window. The meaningful error is treating either measure as though it proves every other commercial fact.
For collectors, this is especially relevant. A high order volume for an exclusive does not automatically establish that every copy quickly reached a buyer. Conversely, a strong sell-through ranking from participating shops does not reveal the final market position after unreported chains, bookstores, subscriptions, and digital formats are considered. Physical collectibles can create similarly messy demand signals; a display product such as LEGO’s Shenron & Goku set is a reminder that collector interest and complete sales visibility are not necessarily the same thing.
What Prana says its list represents
Freeman publicly identified the sources behind Prana’s bestseller list: Manage Comics, Comic Shop Assistant, and additional retailers supplying data outside those systems. He said the company offers weekly and monthly top 400 lists through its newsletter, along with a market-share report based on the collected sales information.
He also said Prana has compared its rankings with large retailers it speaks with and found that the placements generally held up, with some exceptions. That is not equivalent to external confirmation of every position or a complete census of the market. It is, however, a description of how the organization attempts to test whether its panel is producing rankings that resemble performance observed beyond the panel itself.
In market research terms, the store group is a sample: a portion of the overall retail landscape used to identify patterns. A sample can be robust, but its strength depends on more than headline size. The participating stores need not only to be numerous; their sales behavior, geography, customers, and product mix must also be sufficiently representative of the broader market for the conclusions readers want to draw.
The available information establishes the size Freeman cited—600-plus stores and 80,000-plus consumers—but does not establish a full statistical audit of representativeness. That means readers should regard Prana’s rankings as a substantial view into participating direct-market activity, not as a complete national ledger.
Why the public dispute got personal
The exchange escalated beyond a methodological disagreement after Liefeld called chart promoters “snake oil salesman” in a post criticizing the data. Freeman took the remarks as referring to Prana and answered with an explanation of its data sources and limitations.
Freeman later said Liefeld had blocked him, and argued that calling someone a “snake oil salesman” while preventing a reply made a genuine discussion difficult. On a Comic Industry Insiders livestream with Manage Comics co-host Brian Garside, Freeman reiterated that objection and said Prana planned Snake-Oil-branded merchandise as a joke at the expense of the accusation.
There is no indication here that the two sides resolved their disagreement. More importantly, the underlying debate does not have a simple winner because they are emphasizing different standards. Liefeld is objecting to the idea that an incomplete panel can settle total-market sales. Prana is defending the value of a large, disclosed panel that records sell-through and preorder activity.
How readers should use comic sales rankings
The practical takeaway is not that charts are useless, nor that a chart rank should end a conversation. It is to read the methodology before treating the list as evidence.
- Ask whether the ranking measures retailer orders, customer sell-through, preorders, or a blend.
- Check the time frame. A weekly result and a long-tail sales result can tell very different stories.
- Look for the size and identity of the reporting pool, while remembering that a large sample is still not the entire market.
- Be cautious with exclusive covers and other releases whose order profile may differ sharply from their eventual customer sales.
- Do not convert a rank into a precise national unit total unless the publisher or data provider has actually disclosed a defensible estimate and its methodology.
Comics sales data is fragmented, and the current argument has made that fragmentation unusually visible. The absence of a definitive public chart leaves room for debate, marketing spin, and honest uncertainty. But it also leaves room for carefully framed panels to offer useful evidence about what readers are buying at participating shops. The important thing is to know which claim a chart can support—and which claim it cannot.