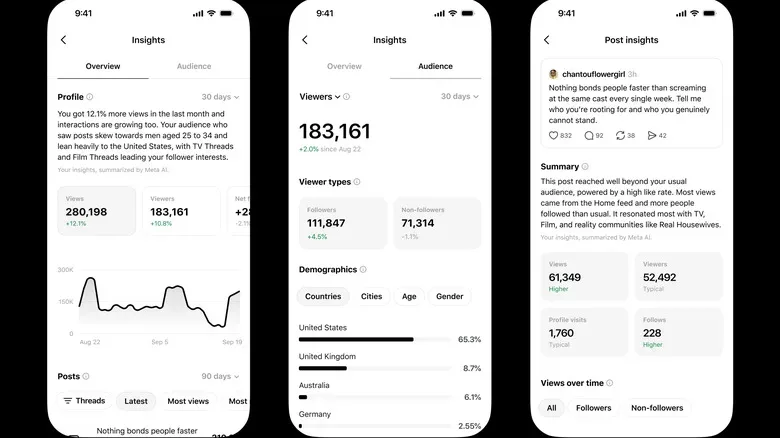

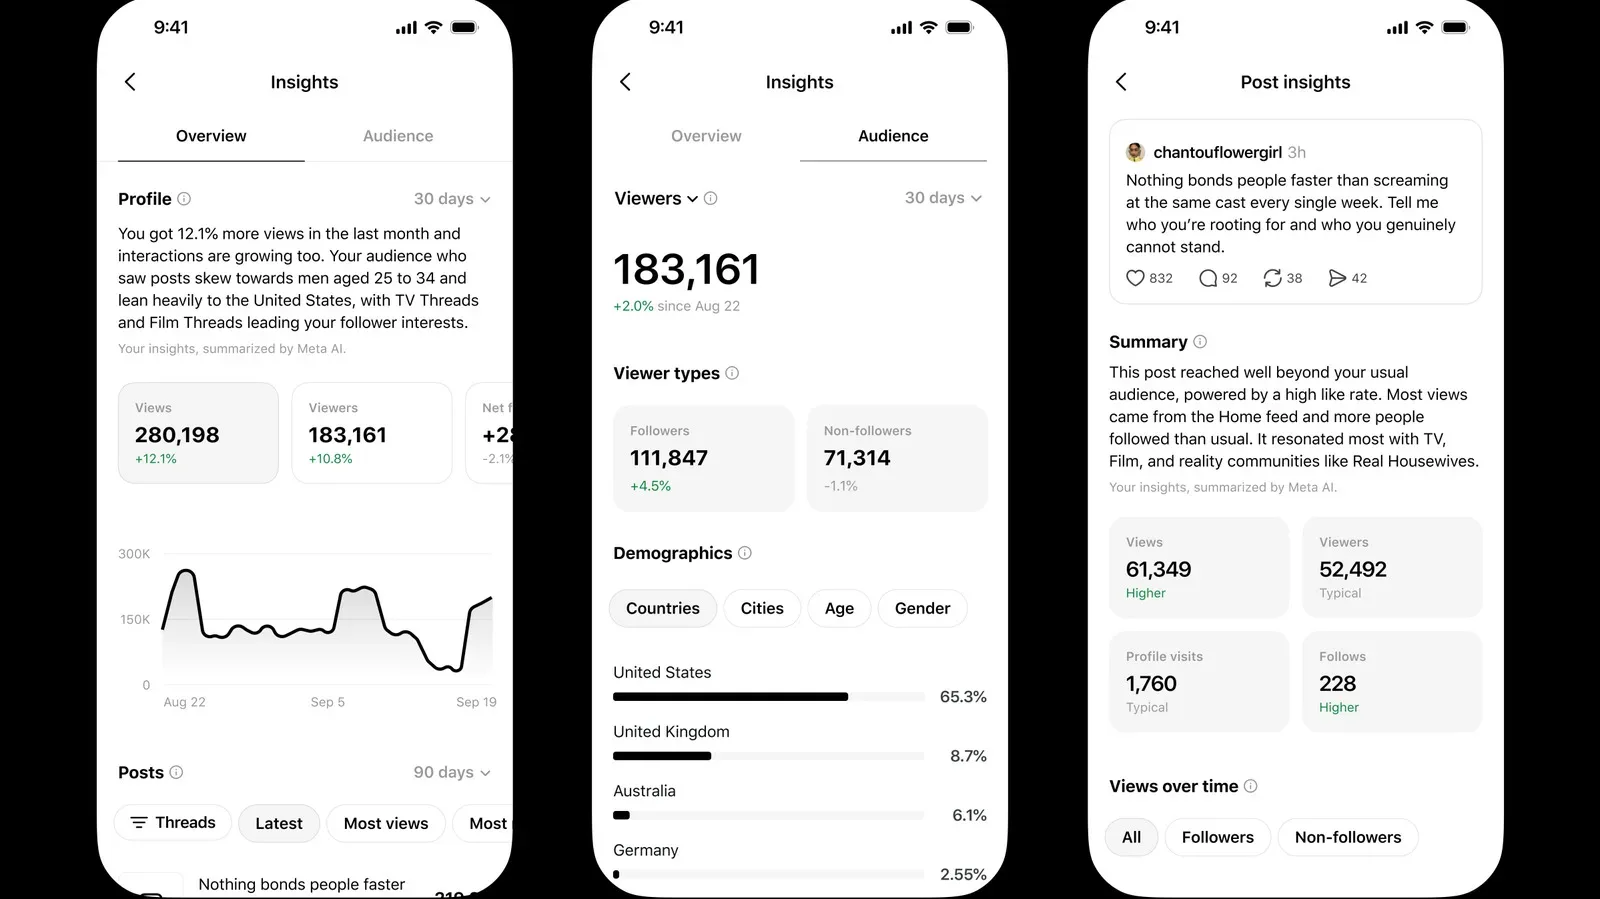
Threads is giving creators and habitual posters a more talkative dashboard. Meta has redesigned the app’s Insights area so that it does more than stack up raw views, likes, reposts and viewers like a collection of tiny numerical trophies. The updated tools now offer AI-generated summaries and comparisons intended to explain whether a post performed above, below or roughly in line with a user’s recent activity.
There is one very conspicuous omission from this new pile of context: link clicks. Threads previously offered creators data about how links were performing. That metric has disappeared, and it remains absent from the broader analytics overhaul. So the platform is now better equipped to say a post was unusually popular, identify the communities involved, and point to favorable posting times—while declining to reveal how many people actually left Threads through a URL.
It is a fittingly modern dashboard dilemma: the spreadsheet has become more conversational, but one of the numbers publishers, creators and businesses may care about most has quietly exited through a side door.
An algorithm-first feed gets a clearer scorecard
Threads is heavily shaped by recommendations. Its default experience emphasizes a “for you” feed rather than a purely chronological stream from accounts a person follows. Posts can also be recommended into Instagram and Facebook feeds. In practice, that means reach can depend considerably on the platform’s recommendation systems, even for an account with a substantial follower count.
That distribution model can make the ordinary creator question feel especially difficult: Why did that post travel, while this one sank with the elegance of a controller thrown into a swimming pool? A dashboard cannot fully unpack an algorithm, but the revised Insights panel attempts to offer a little more context around the result.
At the individual-post level, Threads continues to show familiar activity measures, including views, viewers, likes and reposts. The difference is that it can frame those results against the creator’s recent posts. Instead of requiring someone to manually compare a run of numbers, the interface can label a metric as higher, lower or typical for that account.
Meta AI-powered summaries are part of that presentation. A summary may flag that a post received dramatically more views than recent posts while noting that the proportion of people who liked it was lower. That distinction matters. Big reach and strong appreciation are not always the same thing, and a viral-ish post can be an audience-expanding success, an engagement disappointment, or the digital equivalent of someone looking into the shop window without coming inside.
Communities move closer to the center of the readout
The revamp also ties analytics more closely to Threads’ interest-based communities. Threads has been promoting communities as a way for people to find topical conversations, and its analytics can now identify which communities drove engagement on a specific post.
Related coverage includes Threads Expands Analytics With AI Summaries but Drops Link-Click Data.
For gaming-focused accounts, that kind of signal could be more useful than a plain view count. A creator covering a major remake, for example, may be able to see whether the response is being led by a Nintendo-oriented group, a retro crowd, or an adjacent technology audience. A post about The Legend of Zelda: Ocarina of Time Remake could attract very different attention depending on the community context surrounding it. The redesigned analytics do not promise a magic recipe for repeatable reach, but they could help users see where a conversation actually found traction.
That is meaningful because broad distribution can otherwise obscure the makeup of an audience. A post may appear to have succeeded based on views alone, yet the people encountering it might not be the group a creator expects—or the group most likely to respond to future posts. Community information offers another layer: not simply how far a post traveled, but which interest clusters helped carry it.
Profile-level Insights aim for the bigger picture
The changes do not stop at individual posts. Threads is also using AI summaries to provide a broader account-level snapshot. These overviews can describe a period as quieter than usual, point out declines in views and interactions, identify leading communities among viewers, and compare viewer interests with the interests associated with an account’s followers.
Demographic information is part of that zoomed-out view as well. The updated Insights can surface details such as the gender and age range that made up much of an account’s audience during a given period. It can also highlight days of the week and times of day that produced the strongest reach.
Those details are not a guarantee that posting at a particular hour will unlock the recommendation vault. Audience behavior changes, topics change, and one strong post can heavily color a small sample. Still, the information is more actionable than a lonely total-view figure. If Tuesdays at a certain time regularly produce better reach, that is at least a clue worth testing over time. If an account’s viewers are clustering around Tech Threads and AI Threads while its followers have more interest in Book Threads, that mismatch may be informative too.
The AI framing is designed to make these patterns easier to spot without forcing every user to become their own analytics department. It is the dashboard equivalent of a helpful sidekick pointing at the chart and saying, “This bar is doing something weird.” The crucial limitation, as ever, is that summaries are interpretations of platform data rather than a complete explanation of causation. A higher-performing post might have benefited from timing, topic, community attention, reposts, cross-app recommendations or a mix of factors that no short summary can neatly isolate.
The missing link-click metric is the awkward part
Threads had introduced information about link performance in an update last year, positioning those tools as a way to help creators understand reach beyond the service itself. Link-click data has since been removed. The change happened before this latest analytics redesign, though the precise timing has not been made clear.
The absence is notable because clicks answer a different question from views or likes. A view indicates that a post appeared and was counted as seen; a click can show that someone took the additional step of opening an external destination. For a creator whose goal is newsletter sign-ups, store visits, a video page, a long-form guide or a portfolio, that distinction is enormous. The gap between “many people noticed the post” and “some people went where the post pointed” can be wider than the gap between a casual match and an esports final.
Some creators have long suspected that posts containing URLs receive less favorable distribution on Threads. Separately, previous reporting indicated that link clicks were rare among Threads users. Neither point alone establishes why Meta removed the metric, and the available information does not settle whether the missing data reflects a product-priority shift, low user interest in leaving the app, a change in measurement strategy, or something else.
When asked why creators can no longer track link clicks, a Meta spokesperson said the company was “exploring” the feature, without explaining why it was removed. That leaves a substantial question mark hovering over an otherwise more detailed analytics offering.
What creators can still learn from the redesigned dashboard
Despite the missing outbound-click number, the updated Insights package gives Threads users a more structured way to assess performance. It is particularly geared toward understanding relative results rather than treating every post as an isolated score.
- Compare against your own baseline: Higher, lower and typical labels can make changes in performance easier to recognize.
- Separate reach from response: A post with exceptional views but weaker likes may have reached a wider, less invested audience.
- Watch the community signal: Identifying communities that drive engagement may help clarify where a topic resonates.
- Use timing data carefully: Strong days and hours are useful clues, not invincibility stars.
- Read audience differences closely: Viewer interests and follower interests may not perfectly overlap, especially when recommendations are doing much of the distribution work.
For people using Threads mainly as a conversational destination, this may be enough. The platform is delivering more feedback about whether its own audience systems are amplifying a post and who is reacting to it. For users who depend on sending people elsewhere, the picture is less complete. They can see more about in-app attention, but not the direct measure of off-platform traffic that previously existed.
Threads’ analytics makeover therefore carries two messages at once. Meta is adding more explanation around posts, communities, audiences and timing, with AI positioned as the dashboard narrator. At the same time, the removed link-click stat suggests that outbound behavior is not receiving the same prominence. The numbers now provide a better map of life inside Threads. Anyone trying to measure the journey beyond it will have to navigate with less help.