
The scoreboard for television streaming looks rather different when it is measured by time spent watching on a TV instead of subscribers, app installs or mobile viewing. In July 2026, YouTube accounted for 14.2% of US television viewing, ahead of Netflix at 7.8%. That makes YouTube’s TV share nearly twice Netflix’s for the month—and it comes before counting the countless tutorial, music, podcast and creator-video sessions that happen on phones and computers.
The more revealing part of the picture may be what happens below those two giants. The Roku Channel registered a 2.9% share, narrowly above Peacock’s 2.6%. Tubi reached 2%, while Warner Bros. Discovery’s combined streaming services, HBO Max and discovery+, accounted for 1.4%. Free, ad-supported services are therefore not simply filling spare space between subscription apps. On this particular TV-viewing measure, they are competing directly with prominent paid brands and large studio portfolios.
That does not mean a free app has suddenly become more valuable than every paid streaming business, nor does it settle which service has the largest audience. It does show that the living-room battle is broader than a monthly-subscription ranking. Viewers are making room for creator video, ad-supported catalogues, live channels, podcasts and traditional premium programming—and the most-watched destinations are not always the ones with the loudest prestige-TV identity.
What the percentages actually measure
The figures track viewing time on television sets. This distinction matters. A viewing share is the portion of measured TV watching claimed by a service or group of services during a period. It is not a subscriber total, a count of accounts, a measure of revenue or an assessment of how many people have installed an app.
For July 2026, streaming represented 49% of all TV time. YouTube’s 14.2% is therefore an exceptionally large portion of the overall TV landscape, not merely a reminder that its app is popular on connected televisions. Netflix’s 7.8% remains substantial, but the gap underscores the effect of YouTube’s much wider mix of material: individual creators, clips, podcasts and videos of every length alongside professionally made entertainment.
There is an important methodological boundary around YouTube’s result. Live channels viewed through YouTube TV are counted in broadcast or cable viewing rather than being added to YouTube’s streaming total. In practical terms, the reported 14.2% does not get an extra lift from that pay-TV service’s live-channel viewing. The number is still not a complete measure of YouTube consumption, either, because it is limited to television viewing and excludes phone viewing.
That combination makes the result notable. A platform strongly associated with creator-led video is leading on the biggest screen in the home even under a measurement that leaves out the smaller-screen use many people instinctively associate with YouTube.
Why grouped services require caution
The rankings are useful, but not perfectly like-for-like. Disney’s 4.7% result combines Disney+, Hulu and ESPN+. Paramount’s 2.2% combines Paramount+ and Pluto TV. Warner Bros. Discovery’s 1.4% combines HBO Max and discovery+. By contrast, The Roku Channel and Tubi are each counted individually.
That means the most responsible reading is not that a single free service has unambiguously eclipsed an entire entertainment company in every meaningful sense. Rather, each listed service or service group captured the stated portion of July television viewing under the reported grouping. The distinction is especially relevant for readers comparing apps, business strategies or the reach of a particular brand.
- YouTube: 14.2% of US TV viewing in July 2026.
- Netflix: 7.8%.
- Disney’s services: 4.7% combined across Disney+, Hulu and ESPN+.
- Prime Video: 4.2%.
- The Roku Channel: 2.9%.
- Peacock: 2.6%.
- Paramount’s services: 2.2% combined across Paramount+ and Pluto TV.
- Tubi: 2%.
- Warner Bros. Discovery’s services: 1.4% combined across HBO Max and discovery+.
The timing also matters. These are July figures, before Paramount, now Skydance, acquired Warner Bros. Discovery on October 6. Corporate structures and distribution plans can change, but the monthly viewing data reflects the market as it stood before that acquisition.
Free with ads is a distinct proposition, not a lesser subscription
The Roku Channel and Tubi both offer movies, shows and live channels without a required subscription. The tradeoff is advertising. This model is often described as ad-supported streaming: instead of viewers paying a recurring fee to remove the financial barrier to entry, advertisers support access and viewers spend time with commercials.
For a household already balancing multiple paid plans, the appeal needs little explanation. A free service can be opened for a familiar older series, a hard-to-find movie, a channel that happens to suit the moment, or simply background viewing without triggering another monthly charge. Viewers discussing Tubi have specifically pointed to older programming and difficult-to-locate films as part of the draw. They have also raised concerns that the advertising load could increase, a reminder that “free” does not mean costless in terms of attention or interruptions.
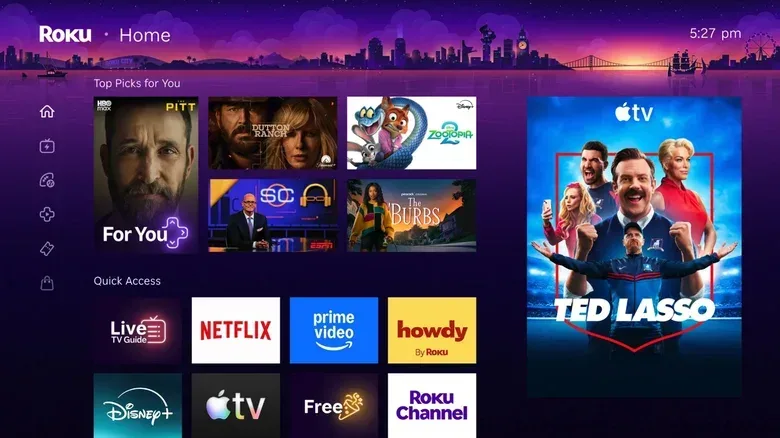
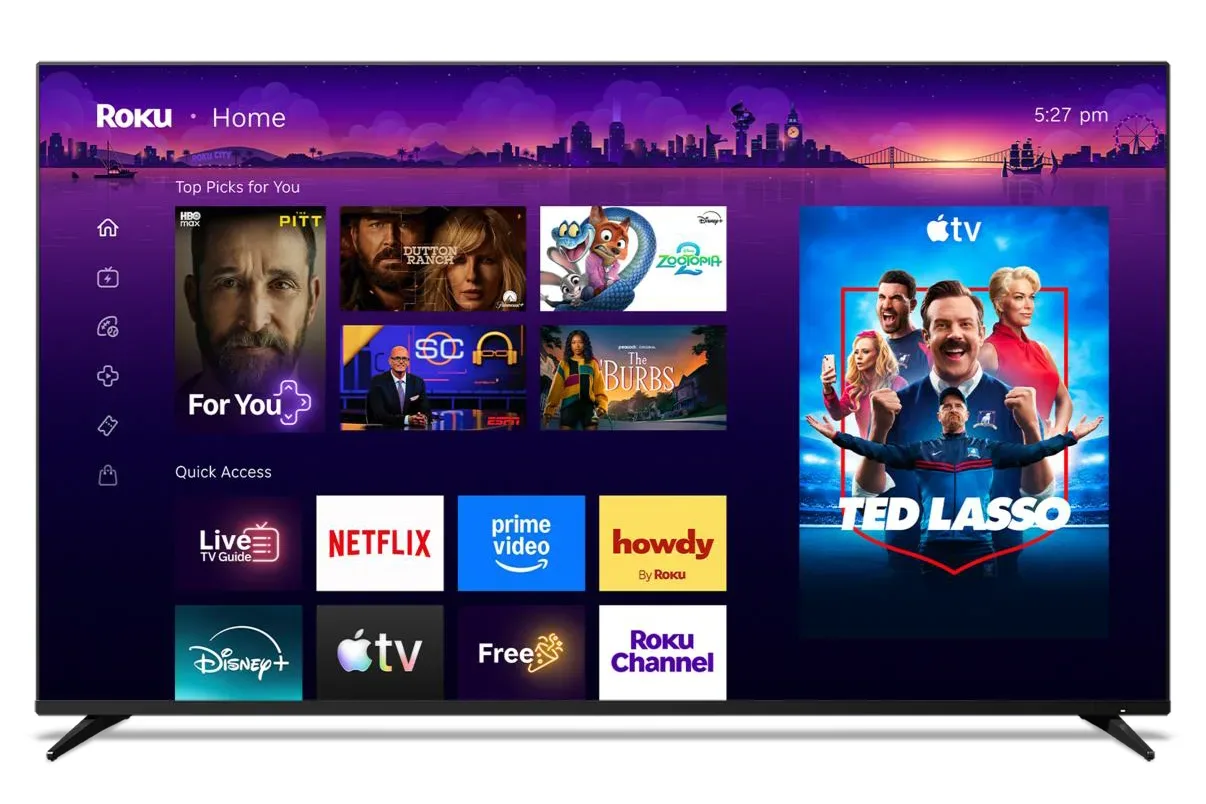
The Roku Channel’s position is also not dependent on owning a Roku device. Its free catalogue can be watched in a browser and on compatible Samsung and Fire TV devices. Roku also sells optional subscriptions to other streaming services, but those paid add-ons are separate from the core idea behind its free catalogue.
Tubi does not offer a paid subscription tier. That makes its 2% July share particularly clean as an example of ad-supported TV streaming holding its own beside companies that rely partly or primarily on subscription revenue.
Paid services still have different ways to monetize attention
The divide is not simply free apps on one side and paid apps on the other. YouTube’s regular videos are generally free with ads, but it also supports movie rentals and purchases, YouTube Premium subscriptions and individual creator memberships. Prime Video likewise offers rentals and add-on channel subscriptions. Netflix is principally built around recurring plans.
For viewers, this means a platform’s viewing share should not be mistaken for a single business model. A service can use free programming to build habit, then offer optional paid features. Another can foreground a subscription but provide different transaction types elsewhere in its ecosystem. The lesson of July’s numbers is less “subscriptions are over” than “viewing time is being won through several routes at once.”
Peacock’s July shows why a single month can move quickly
Peacock finished behind The Roku Channel in the reported ranking, yet its July was still strong. TV viewing on the service rose 15% from June. World Cup coverage helped increase attention, and Love Island USA generated 4.9 billion viewing minutes during the month.
That is a useful warning against treating a monthly share chart as a permanent league table. Sports, major episodes and cultural moments can rapidly alter viewing behavior. A service may gain sharply in a month because it has programming people want to watch promptly, while catalogue-driven apps can benefit from their ability to satisfy many smaller, everyday viewing decisions.
There is an additional caveat around Tubi’s number: the measurement firm was still evaluating the effects of a June change in how Tubi was measured. The published 2% remains the reported July figure, but the ongoing evaluation is material context when comparing close results or drawing sweeping conclusions from a narrow margin.
YouTube’s living-room podcast growth adds another clue
Television sets are no longer reserved for scripted series, movies and live events. YouTube reported more than 700 million hours of podcasts watched on living-room devices in October 2025, up from 400 million a year earlier. That increase helps illustrate why platform labels can mislead. Podcasts may be audio-first in form, but video versions, interviews, commentary and creator shows can function as television viewing once they move to the living-room screen.
This may be the central practical implication for studios, streaming services and viewers: competition for TV time now comes from far more than another library of films and series. A viewer deciding what to put on a television might select a premium drama, a free movie, a live channel, a creator’s long-form video or a video podcast. All can occupy the same screen and compete for the same evening.
That competition extends beyond television. The entertainment calendar is already crowded enough that a major game release can affect people’s plans, as reflected in reported time-off demand tied to GTA 6’s release. Streaming platforms are likewise competing for finite leisure time, not just against their direct app-store rivals.
Roku and Tubi could become even more strategically connected
Fox owns Tubi and agreed in June to acquire Roku in a transaction valued at about $22 billion. Roku confirmed on October 19 that the deal remained pending. If completed, the arrangement would bring a major free streaming service and Roku’s platform business under the same corporate umbrella.
For now, the key point is not to assume an outcome or predict product changes before the transaction is complete. The July results simply make the pending deal more interesting: The Roku Channel and Tubi were already two of the free services demonstrating meaningful TV viewing share, each with a different place in the connected-TV ecosystem.
July 2026’s data does not crown a universal “best” streamer. It does, however, provide a clear answer to a narrower question: where did Americans spend time watching on television sets that month? YouTube led decisively, Netflix followed, and free ad-supported services proved they can command attention alongside subscription heavyweights. For anyone choosing services, funding programming or building a connected-TV strategy, that is a harder market to summarize with subscriber counts alone.