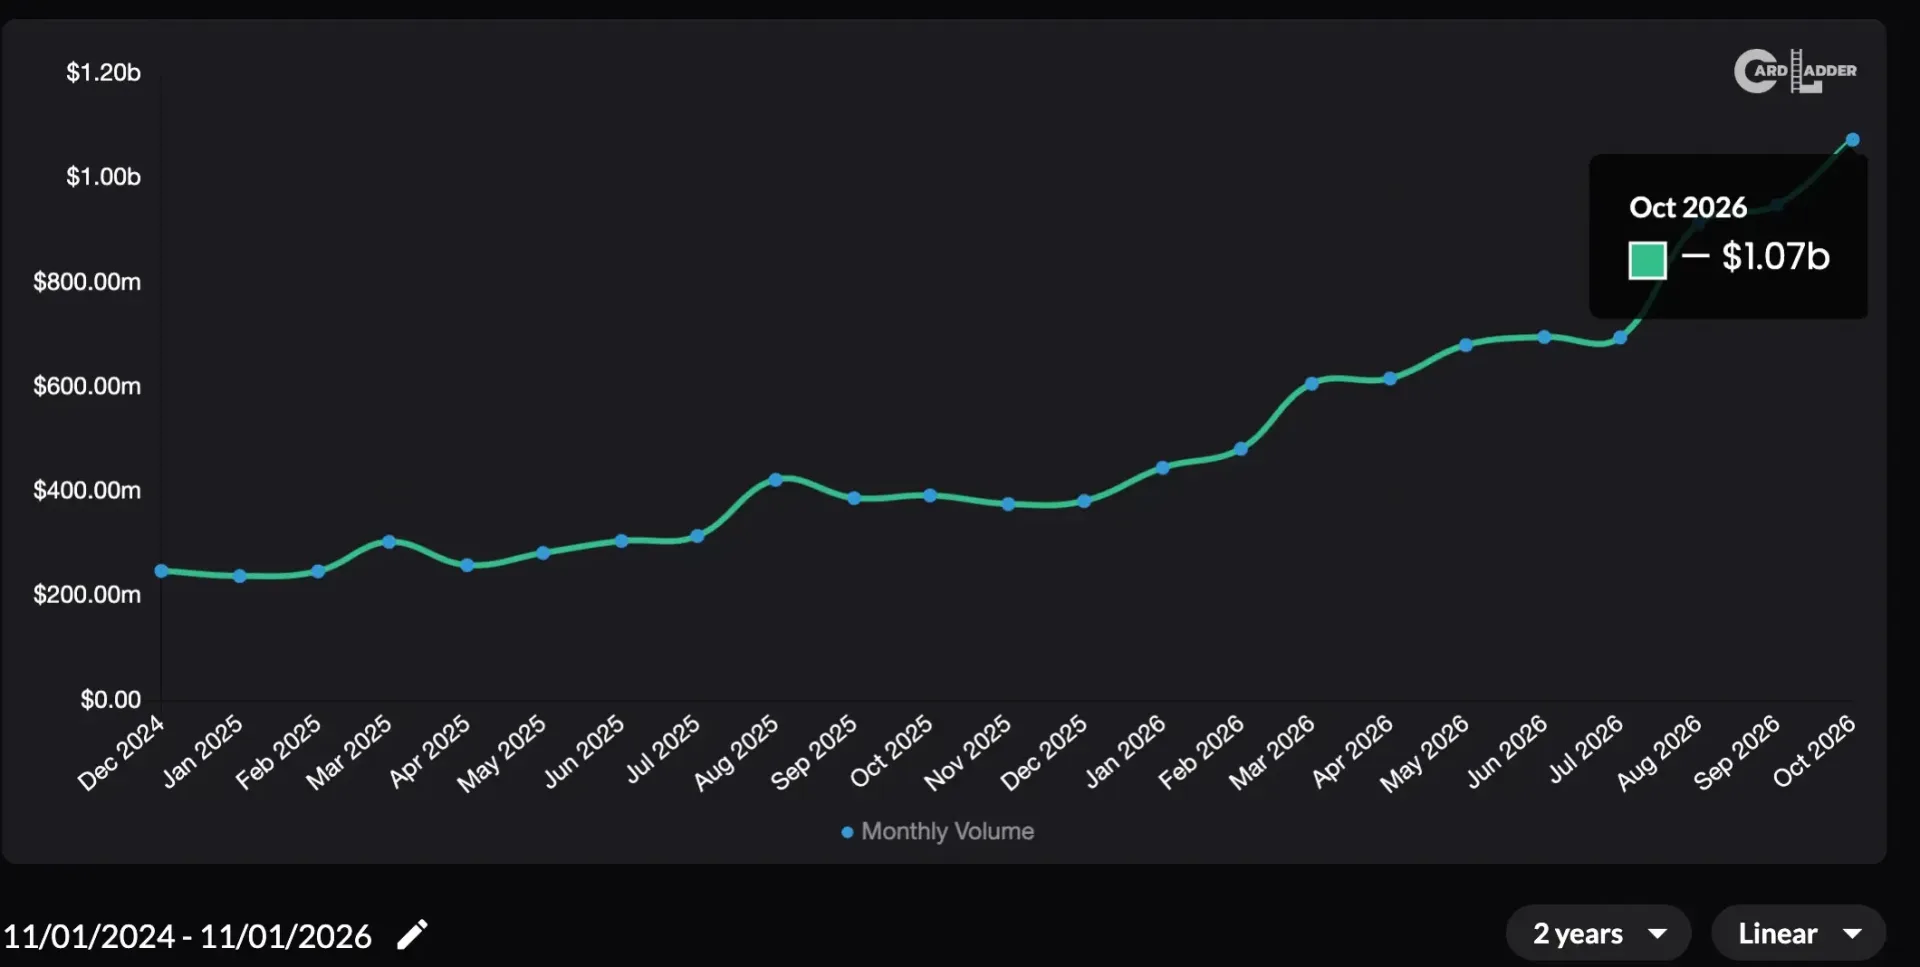

A $1 billion month sounds like a clean verdict: trading cards are soaring, everybody is spending, and every corner of the hobby must be feeling the lift. October’s reported total—$1.075 billion from 9,216,743 card and sealed-wax sales across categories—is undeniably enormous. But it is not a one-size-fits-all measure of collector demand or card values.
Break the sales into price bands and the picture becomes more useful. The market was extremely active at the low end, generated its largest pool of dollars in the $1,000-to-$9,999 range, and received an outsized contribution from a tiny set of high-end transactions. That is not a contradiction. It is the difference between sales volume, meaning the number of completed transactions, and dollar volume, meaning the total money attached to them.
For collectors, dealers and anyone tempted to use “the hobby did a billion” as a personal market report, that distinction is the entire story. A total can be real while still concealing radically different conditions at different price points.
The headline number: 9.2 million sales, $1.075 billion
October’s total covers cards and sealed wax in every tracked category. It is therefore broad in scope, but broad does not mean even. The money was distributed in a shape closer to a pyramid than a flat playing field.
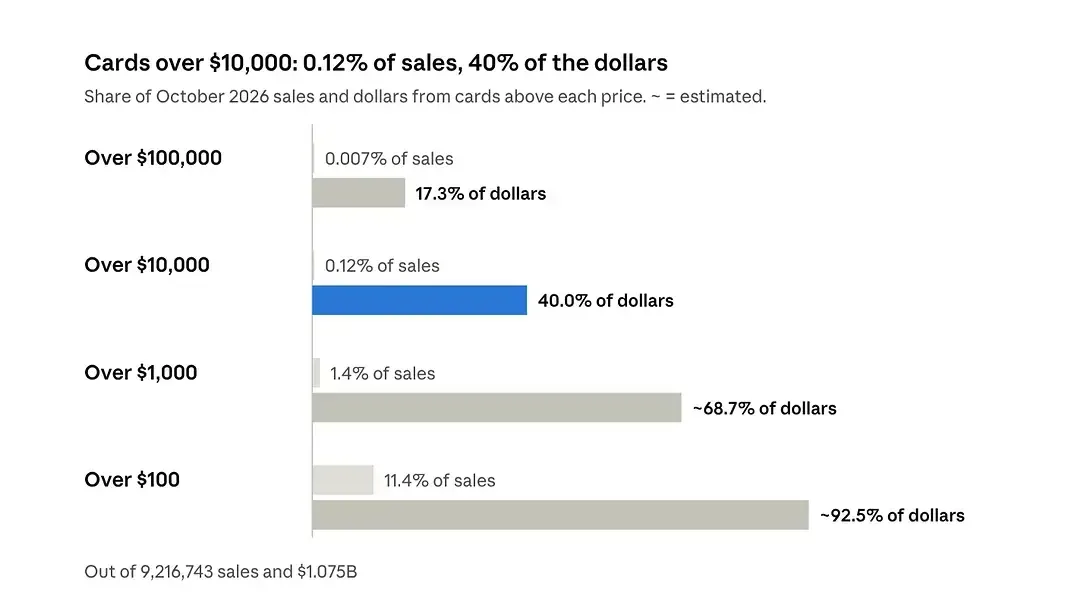
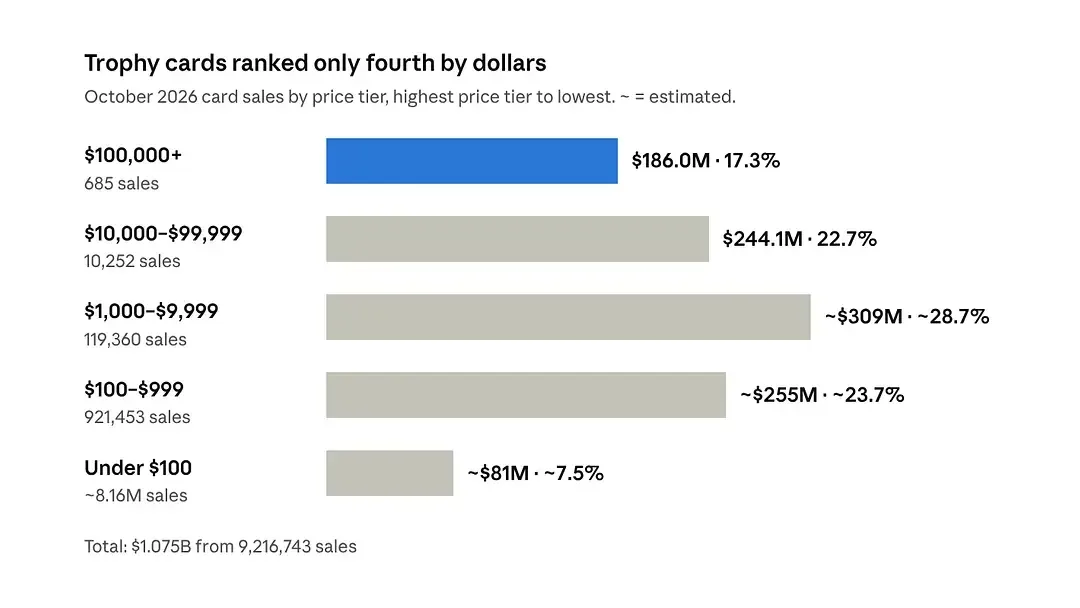
- More than 8.16 million sales—about 88.6% of all transactions—were under $100.
- Those sub-$100 sales produced roughly $81 million, or 7.5% of the monthly dollar total.
- The $100-to-$999 and $1,000-to-$9,999 bands combined for roughly $564 million, around 52% of October’s dollars.
- Sales above $10,000 made up about $430 million, 40% of the total, despite representing only about 11,000 transactions.
The most immediate takeaway is that activity and spending are not the same measurement. The under-$100 level supplied the overwhelming majority of transactions, yet represented the smallest share of reported dollars. Conversely, the high-end market had very few sales, but each one could move the monthly aggregate dramatically.
That matters because a collector buying base singles or low-cost additions to a personal collection is participating in a vastly different market from a buyer pursuing a six-figure, graded one-of-one. Combining both into one number is useful as a measure of total commerce. It is much less useful as a price signal for either group.
The $1,000-to-$9,999 tier was October’s largest dollar contributor
The most important price band in the October data was not the $100,000-plus trophy tier. It was $1,000 to $9,999, which accounted for about $309 million—the single largest contribution among the five tiers. The next band down, $100 to $999, added roughly $255 million.
Together, those two bands generated just over half of the month’s total dollars from a little more than one million sales. This is the section of the market where a broad range of serious collector purchases can sit: graded rookie cards, low-numbered parallels and vintage pieces are examples associated with the range. It has enough transaction depth to matter economically without depending on only a handful of major lots.
Related coverage includes October’s $1.075 Billion Card Market Shows Where the Hobby’s Money Really Comes From.
Calling this group the market’s “middle” is an interpretive shorthand, not a claim that every buyer has the same budget or collecting goal. Still, it is a useful way to read the data. A market segment with about a million sales and roughly $564 million in spending tells us more about sustained participation than a month defined solely by a few blockbuster results.
It also offers a practical way to check a flashy market claim. Someone whose typical purchases are between $100 and $9,999 should look first at the supply, sales frequency and completed prices in that range. They should not assume a seven-figure sale has made their own cards more liquid or more valuable. Liquidity, in this context, is the ease with which a card can find a buyer near an expected price. A large total-sales figure does not automatically improve liquidity in every tier.
Why 685 ultra-high-end sales still loom so large
Cards sold for at least $100,000 accounted for 685 transactions in October. That is approximately 22 sales a day across the entire hobby, every sport and category included. It is also around one sale for every 13,455 reported transactions.
Yet those 685 sales produced $186 million, or 17.3% of the $1.075 billion monthly total. Their average sale price was about $271,582. The math explains the attention: each sale in this band carries enough financial weight to become a headline and meaningfully affect a monthly total.
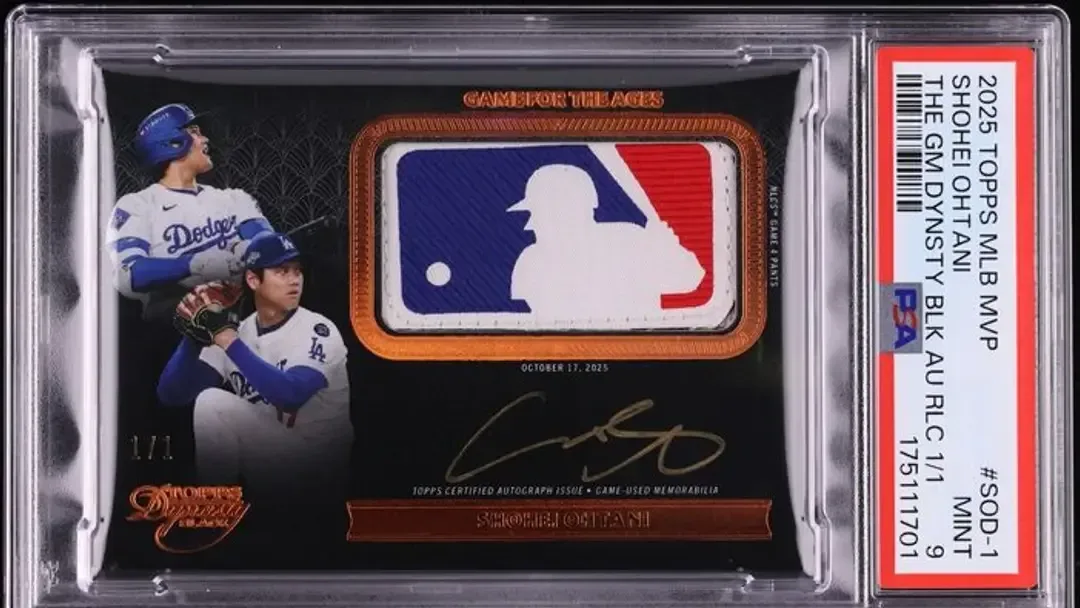
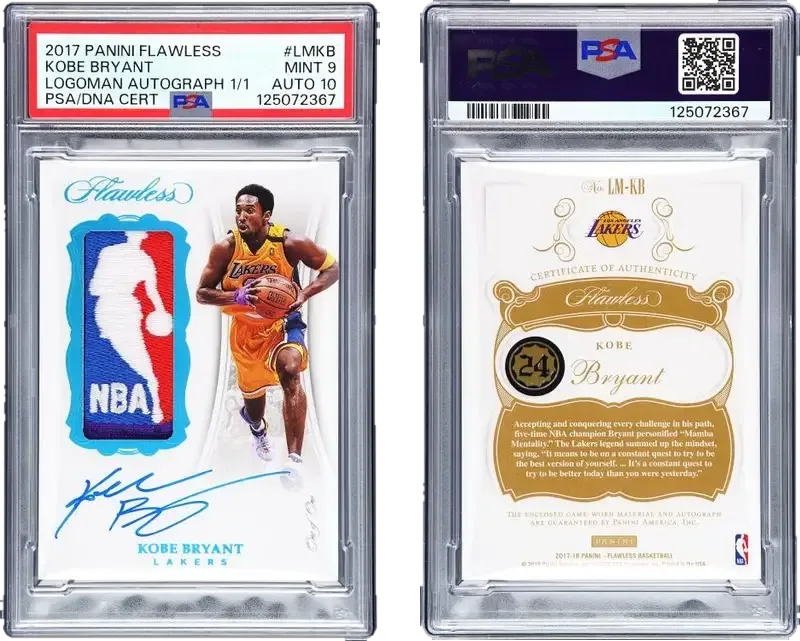
Among the standout results were a 2017 Panini Flawless Logoman Autograph 1/1 Kobe Bryant, graded PSA 9 with a 10 autograph, at $4.2 million; a 2026 Panini World Cup Prizm Choice Nebula 1/1 Lionel Messi graded BGS 9 at $1.25 million; and a 2025 Topps MLB MVP The Game Dynasty Black Shohei Ohtani MLB Logoman Patch Auto 1/1, graded PSA 9, at $3.24 million.
These are significant sales, and they provide a real reading of demand for exceptional material at the top of the market. They are not, however, a complete diagnosis of the broader hobby. A trophy-card result may reflect the appeal of a particular player, a one-of-one card, a Logoman patch, a scarce autograph, a grade or a motivated set of bidders. It need not indicate that entry-level, midrange or even other premium cards moved in the same direction.
The grading labels in those examples are relevant descriptors, not guarantees of a universal price outcome. PSA 9 and BGS 9 denote grades assigned by grading companies, while an “Auto 10” refers to the autograph grade on the Kobe Bryant card. Grade and autograph assessment can be major elements of a card’s individual market appeal, especially for condition-sensitive premium cards. But the October numbers show why an individual high-grade result should be treated as a specific transaction, not a shortcut to a market-wide conclusion.
Above $10,000: a small transaction count, 40% of the money
The sharpest concentration appears when the high end is widened beyond six-figure cards. Sales over $10,000 reportedly totaled about 11,000 transactions, only 0.12% of October’s 9.2 million sales, but contributed roughly $430 million. That is 40% of all dollars spent during the month.
Put differently, 99.88% of October transactions were below $10,000, but those millions of sales combined for the remaining 60% of dollar volume. The high end is not “fake” volume or irrelevant volume; it is a major and legitimate part of the reported total. The caution is that it can make aggregate monthly spending appear much stronger—or much weaker—than the experience of the overwhelming majority of buyers and sellers.
A hypothetical illustrates the sensitivity. If spending on cards above $10,000 declined by 25%, that would remove roughly $108 million from the October total. The resulting monthly aggregate would be down about 10%, even if all 99.88% of transactions below $10,000 remained unchanged. Conversely, an unusually strong run of elite auction outcomes can raise the monthly headline without changing the day-to-day market for the vast majority of cards.
This is not an argument that top-end cards should be ignored. It is an argument for separating measures before interpreting them. The total answers, “How much money changed hands?” It does not independently answer, “Are comparable cards in my collection selling more often?” “Are buyers paying higher prices in my range?” or “Has the available supply changed?”
The lively low end should not be dismissed
The under-$100 segment is easy to overlook when it represents only about $81 million of a billion-dollar month. That would be a mistake. It accounted for roughly 8.16 million transactions, making it the foundation of the market’s activity.
Those transactions include the kinds of purchases that keep collecting accessible: base cards, singles for personal collections and other low-cost additions. This is where the number of buyers, sellers and completed deals is largest. Its relatively small dollar share says more about ticket size than it does about whether people are engaged.
In other words, low dollar volume is not low participation. A collector who finds a modestly priced card needed for a set is taking part in the hobby just as surely as the buyer of a seven-figure rarity. Their transactions simply affect aggregate revenue very differently.
That range can also be an entry point into larger collecting interests. For a current example of how trading cards continue to appear alongside widely accessible promotions, see the return of Pokémon Happy Meals in the US with 15 toys and 15 Pokémon TCG cards. Such items should not be conflated with the October price-tier data, but they underline why the hobby contains many types of participation beyond premium auctions.
How to use a billion-dollar month without letting it mislead you
The October figure is best treated as a starting point. It confirms an immense amount of tracked buying and selling occurred. It also reveals a market with very different layers: a huge base of small transactions, a dollar-heavy middle, and a narrow but exceptionally powerful top end.
For collectors
Track the price tier you actually buy. If your focus lies below $100, the relevant questions are whether the cards you want are available, whether completed sales are stable and whether there is enough buyer interest when you decide to move something. If you buy in the $100-to-$9,999 range, the especially large share of October spending makes that band worth watching closely—but it still does not mean every card within it behaves alike.
For sellers
Do not price a card solely from a headline-grabbing sale above your normal market. Comparable sales should be comparable in player, card, scarcity, condition and grade wherever those details materially affect value. A $1 billion total is a measure of scale, not a comp.
For market watchers
Ask two questions whenever a monthly record appears: how many transactions produced it, and which price tiers produced the dollars? Those questions turn a broad headline into a more durable reading of market structure.
October’s data supports both optimism and caution. There was substantial participation at the low end, strong dollar activity in the $100-to-$9,999 middle, and serious demand for elite cards. At the same time, 40% of all spending rested on roughly 11,000 transactions. The billion-dollar total is real. It simply should not be mistaken for a universal report card on every card, every category or every collector budget.